Zip Codes with the Highest Percentage of Population Taking Taxi / Cab to Work in Princeton, NJ
RELATED REPORTS & OPTIONS
Taxi / Cab
Princeton
Compare Zip Codes
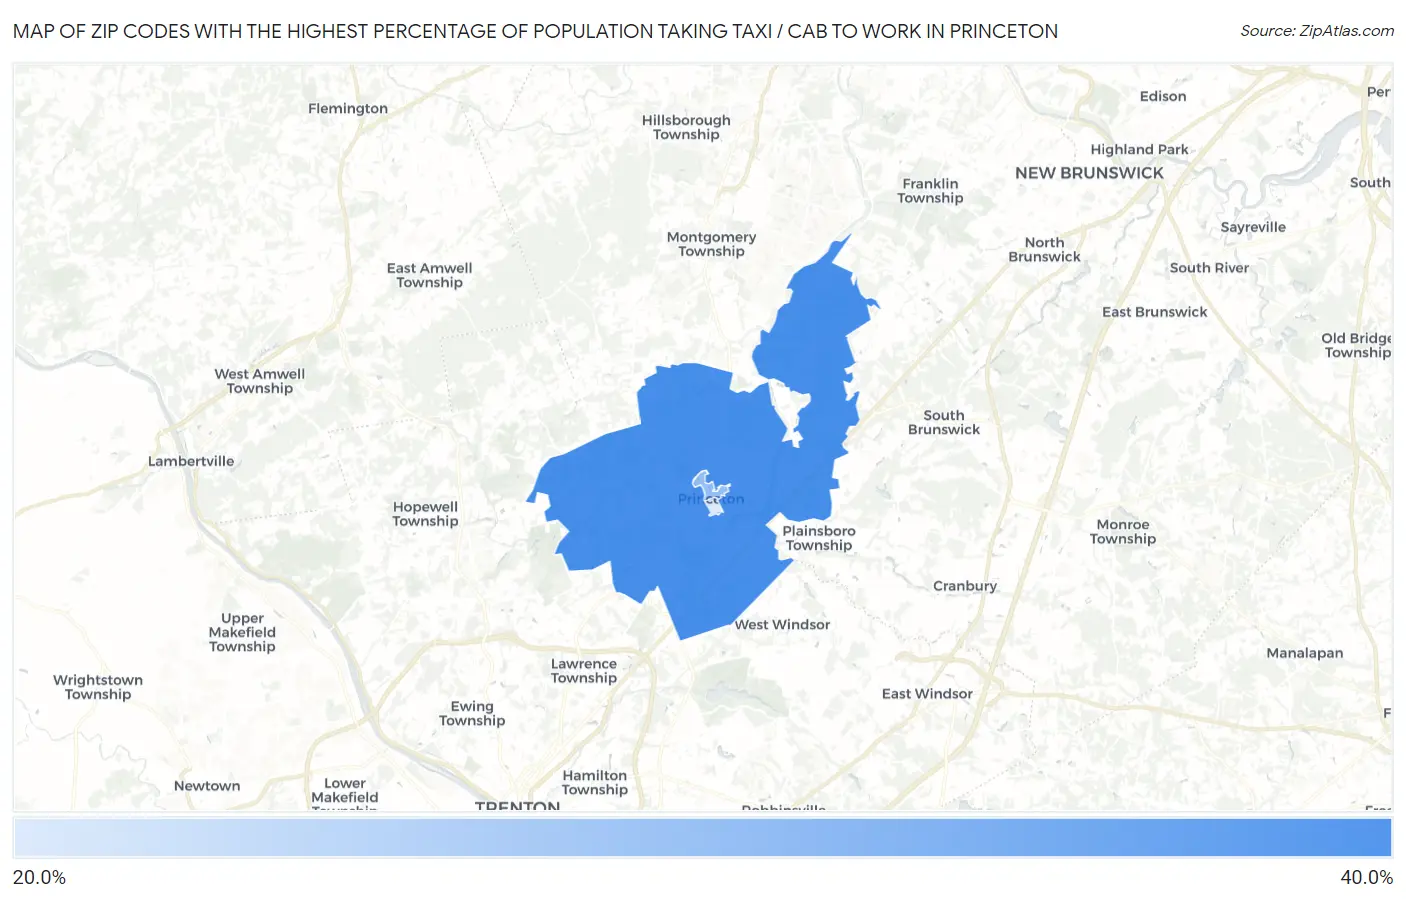
Map of Zip Codes with the Highest Percentage of Population Taking Taxi / Cab to Work in Princeton
21.6%
37.3%
Zip Codes with the Highest Percentage of Population Taking Taxi / Cab to Work in Princeton, NJ
| Zip Code | % Take Taxi / Cab | vs State | vs National | |
| 1. | 08540 | 37.3% | 39.4%(-2.10)#242 | 38.2%(-0.900)#7,795 |
| 2. | 08542 | 28.5% | 39.4%(-10.9)#326 | 38.2%(-9.70)#11,444 |
| 3. | 08544 | 21.6% | 39.4%(-17.8)#354 | 38.2%(-16.6)#12,835 |
1
Common Questions
What are the Top Zip Codes with the Highest Percentage of Population Taking Taxi / Cab to Work in Princeton, NJ?
Top Zip Codes with the Highest Percentage of Population Taking Taxi / Cab to Work in Princeton, NJ are:
What zip code has the Highest Percentage of Population Taking Taxi / Cab to Work in Princeton, NJ?
08540 has the Highest Percentage of Population Taking Taxi / Cab to Work in Princeton, NJ with 37.3%.
What is the Percentage of Population Taking Taxi / Cab to Work in Princeton, NJ?
Percentage of Population Taking Taxi / Cab to Work in Princeton is 30.5%.
What is the Percentage of Population Taking Taxi / Cab to Work in New Jersey?
Percentage of Population Taking Taxi / Cab to Work in New Jersey is 39.4%.
What is the Percentage of Population Taking Taxi / Cab to Work in the United States?
Percentage of Population Taking Taxi / Cab to Work in the United States is 38.2%.