Cities with the Highest Percentage of Population Taking Taxi / Cab to Work in Michigan
RELATED REPORTS & OPTIONS
Taxi / Cab
Michigan
Compare Cities
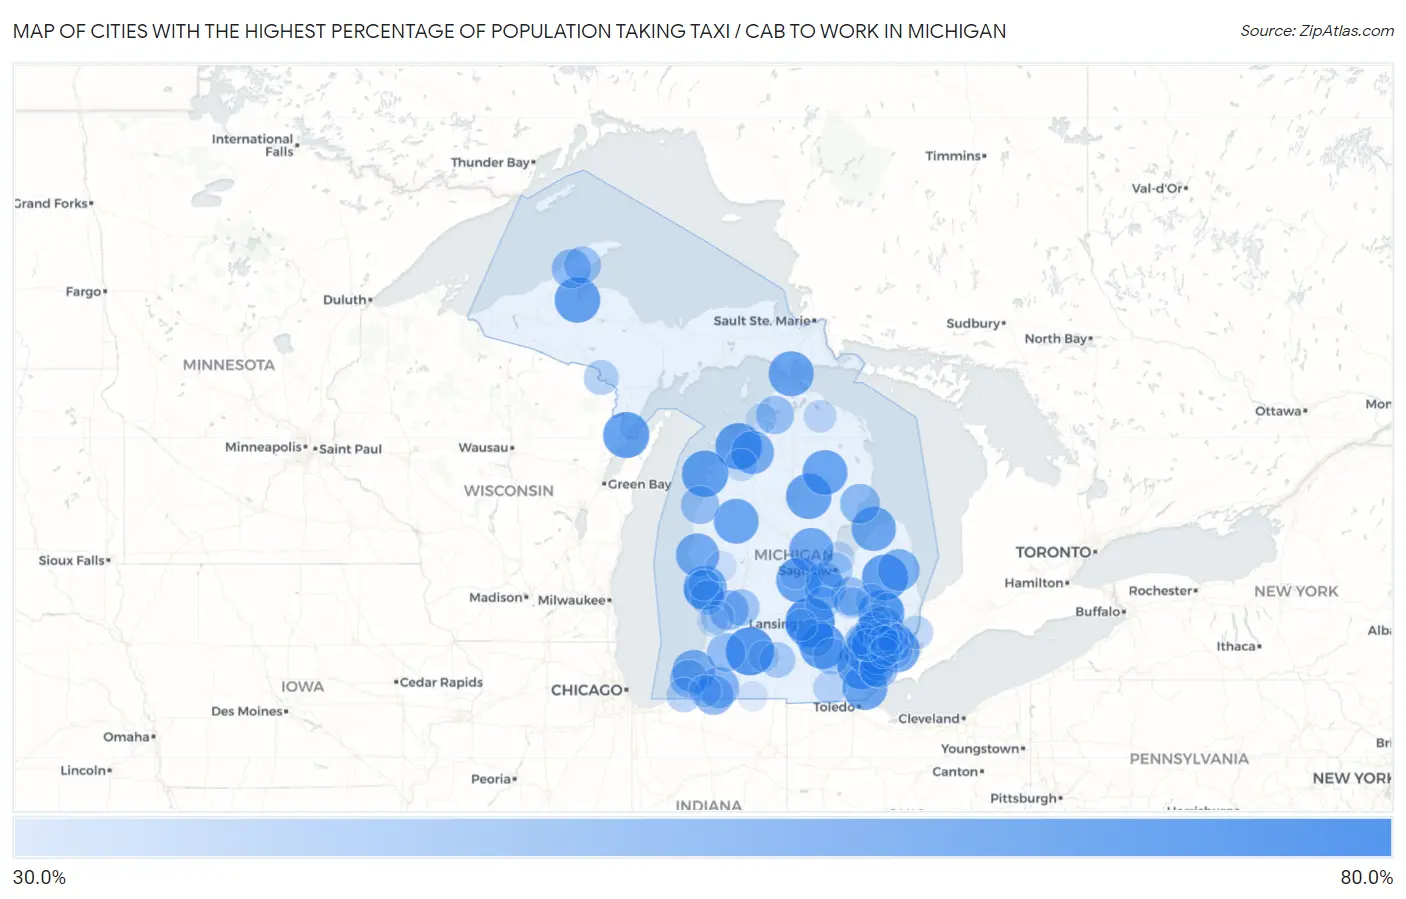
Map of Cities with the Highest Percentage of Population Taking Taxi / Cab to Work in Michigan
0.0%
80.0%
Cities with the Highest Percentage of Population Taking Taxi / Cab to Work in Michigan
| City | % Take Taxi / Cab | vs State | vs National | |
| 1. | Haslett | 64.6% | 36.2%(+28.4)#1 | 38.2%(+26.4)#126 |
| 2. | Richland | 62.5% | 36.2%(+26.3)#2 | 38.2%(+24.3)#209 |
| 3. | Belleville | 62.1% | 36.2%(+25.9)#3 | 38.2%(+23.9)#237 |
| 4. | Suttons Bay | 59.9% | 36.2%(+23.7)#4 | 38.2%(+21.7)#370 |
| 5. | Leonard | 59.8% | 36.2%(+23.6)#5 | 38.2%(+21.6)#380 |
| 6. | Frankfort | 59.7% | 36.2%(+23.5)#6 | 38.2%(+21.5)#383 |
| 7. | Menominee | 59.3% | 36.2%(+23.1)#7 | 38.2%(+21.1)#415 |
| 8. | Marlette | 59.3% | 36.2%(+23.1)#8 | 38.2%(+21.1)#416 |
| 9. | Stockbridge | 58.5% | 36.2%(+22.3)#9 | 38.2%(+20.3)#469 |
| 10. | Baraga | 58.4% | 36.2%(+22.2)#10 | 38.2%(+20.2)#488 |
| 11. | St Helen | 58.1% | 36.2%(+21.9)#11 | 38.2%(+19.9)#527 |
| 12. | Ithaca | 57.6% | 36.2%(+21.4)#12 | 38.2%(+19.4)#569 |
| 13. | St Ignace | 57.6% | 36.2%(+21.4)#13 | 38.2%(+19.4)#570 |
| 14. | Mio | 57.3% | 36.2%(+21.1)#14 | 38.2%(+19.1)#603 |
| 15. | South Monroe | 57.1% | 36.2%(+20.9)#15 | 38.2%(+18.9)#615 |
| 16. | Luther | 57.0% | 36.2%(+20.8)#16 | 38.2%(+18.8)#628 |
| 17. | Caseville | 56.5% | 36.2%(+20.3)#17 | 38.2%(+18.3)#667 |
| 18. | Grosse Pointe Farms | 56.4% | 36.2%(+20.2)#18 | 38.2%(+18.2)#678 |
| 19. | Sanford | 56.0% | 36.2%(+19.8)#19 | 38.2%(+17.8)#732 |
| 20. | Muskegon Heights | 54.8% | 36.2%(+18.6)#20 | 38.2%(+16.6)#873 |
| 21. | Shelby | 54.8% | 36.2%(+18.6)#21 | 38.2%(+16.6)#876 |
| 22. | Elk Rapids | 54.3% | 36.2%(+18.1)#22 | 38.2%(+16.1)#929 |
| 23. | Benton Harbor | 54.1% | 36.2%(+17.9)#23 | 38.2%(+15.9)#962 |
| 24. | Southfield | 53.2% | 36.2%(+17.0)#24 | 38.2%(+15.0)#1,045 |
| 25. | Huntington Woods | 52.5% | 36.2%(+16.3)#25 | 38.2%(+14.3)#1,120 |
| 26. | Sandusky | 52.3% | 36.2%(+16.1)#26 | 38.2%(+14.1)#1,165 |
| 27. | Rochester | 52.2% | 36.2%(+16.0)#27 | 38.2%(+14.0)#1,174 |
| 28. | Chesaning | 51.1% | 36.2%(+14.9)#28 | 38.2%(+12.9)#1,336 |
| 29. | Cassopolis | 51.1% | 36.2%(+14.9)#29 | 38.2%(+12.9)#1,339 |
| 30. | Inkster | 51.0% | 36.2%(+14.8)#30 | 38.2%(+12.8)#1,345 |
| 31. | Dearborn Heights | 50.5% | 36.2%(+14.3)#31 | 38.2%(+12.3)#1,394 |
| 32. | Beverly Hills | 50.4% | 36.2%(+14.2)#32 | 38.2%(+12.2)#1,420 |
| 33. | Norton Shores | 49.4% | 36.2%(+13.2)#33 | 38.2%(+11.2)#1,564 |
| 34. | Highland Park | 49.3% | 36.2%(+13.1)#34 | 38.2%(+11.1)#1,593 |
| 35. | Tawas City | 49.3% | 36.2%(+13.1)#35 | 38.2%(+11.1)#1,603 |
| 36. | Jenison | 49.1% | 36.2%(+12.9)#36 | 38.2%(+10.9)#1,626 |
| 37. | Edwardsburg | 49.1% | 36.2%(+12.9)#37 | 38.2%(+10.9)#1,638 |
| 38. | Franklin | 48.4% | 36.2%(+12.2)#38 | 38.2%(+10.2)#1,783 |
| 39. | Hancock | 48.2% | 36.2%(+12.0)#39 | 38.2%(+10.0)#1,813 |
| 40. | Plymouth | 47.7% | 36.2%(+11.5)#40 | 38.2%(+9.50)#1,887 |
| 41. | Hazel Park | 47.5% | 36.2%(+11.3)#41 | 38.2%(+9.30)#1,921 |
| 42. | Dansville | 47.5% | 36.2%(+11.3)#42 | 38.2%(+9.30)#1,929 |
| 43. | Gobles | 47.4% | 36.2%(+11.2)#43 | 38.2%(+9.20)#1,951 |
| 44. | Lincoln Park | 47.3% | 36.2%(+11.1)#44 | 38.2%(+9.10)#1,955 |
| 45. | St Clair Shores | 47.1% | 36.2%(+10.9)#45 | 38.2%(+8.90)#1,995 |
| 46. | Ferndale | 47.1% | 36.2%(+10.9)#46 | 38.2%(+8.90)#2,001 |
| 47. | Trenton | 47.1% | 36.2%(+10.9)#47 | 38.2%(+8.90)#2,002 |
| 48. | Beecher | 47.0% | 36.2%(+10.8)#48 | 38.2%(+8.80)#2,019 |
| 49. | Manistee | 46.9% | 36.2%(+10.7)#49 | 38.2%(+8.70)#2,030 |
| 50. | Farmington Hills | 46.7% | 36.2%(+10.5)#50 | 38.2%(+8.50)#2,053 |
| 51. | Petoskey | 46.6% | 36.2%(+10.4)#51 | 38.2%(+8.40)#2,082 |
| 52. | Stevensville | 46.3% | 36.2%(+10.1)#52 | 38.2%(+8.10)#2,148 |
| 53. | Lake Linden | 45.2% | 36.2%(+9.00)#53 | 38.2%(+7.00)#2,310 |
| 54. | Berkley | 44.7% | 36.2%(+8.50)#54 | 38.2%(+6.50)#2,361 |
| 55. | East Grand Rapids | 44.4% | 36.2%(+8.20)#55 | 38.2%(+6.20)#2,423 |
| 56. | Chelsea | 43.8% | 36.2%(+7.60)#56 | 38.2%(+5.60)#2,540 |
| 57. | St Charles | 43.5% | 36.2%(+7.30)#57 | 38.2%(+5.30)#2,601 |
| 58. | Dearborn | 43.0% | 36.2%(+6.80)#58 | 38.2%(+4.80)#2,679 |
| 59. | Marshall | 42.8% | 36.2%(+6.60)#59 | 38.2%(+4.60)#2,722 |
| 60. | Pontiac | 42.5% | 36.2%(+6.30)#60 | 38.2%(+4.30)#2,777 |
| 61. | Saginaw | 41.7% | 36.2%(+5.50)#61 | 38.2%(+3.50)#2,943 |
| 62. | Novi | 41.6% | 36.2%(+5.40)#62 | 38.2%(+3.40)#2,957 |
| 63. | Grosse Pointe | 41.6% | 36.2%(+5.40)#63 | 38.2%(+3.40)#2,972 |
| 64. | Iron Mountain | 41.5% | 36.2%(+5.30)#64 | 38.2%(+3.30)#2,992 |
| 65. | Auburn Hills | 41.3% | 36.2%(+5.10)#65 | 38.2%(+3.10)#3,042 |
| 66. | Spring Lake | 41.2% | 36.2%(+5.00)#66 | 38.2%(+3.00)#3,073 |
| 67. | Three Oaks | 41.1% | 36.2%(+4.90)#67 | 38.2%(+2.90)#3,092 |
| 68. | Clawson | 40.4% | 36.2%(+4.20)#68 | 38.2%(+2.20)#3,240 |
| 69. | Owosso | 40.1% | 36.2%(+3.90)#69 | 38.2%(+1.90)#3,318 |
| 70. | Woodhaven | 40.0% | 36.2%(+3.80)#70 | 38.2%(+1.80)#3,343 |
| 71. | Algonac | 39.7% | 36.2%(+3.50)#71 | 38.2%(+1.50)#3,407 |
| 72. | Adrian | 39.4% | 36.2%(+3.20)#72 | 38.2%(+1.20)#3,475 |
| 73. | Zeeland | 39.3% | 36.2%(+3.10)#73 | 38.2%(+1.10)#3,504 |
| 74. | Warren | 39.2% | 36.2%(+3.00)#74 | 38.2%(+1.00)#3,516 |
| 75. | Troy | 38.4% | 36.2%(+2.20)#75 | 38.2%(+0.200)#3,703 |
| 76. | Onaway | 38.4% | 36.2%(+2.20)#76 | 38.2%(+0.200)#3,723 |
| 77. | Flint | 38.0% | 36.2%(+1.80)#77 | 38.2%(-0.200)#3,795 |
| 78. | Traverse City | 37.9% | 36.2%(+1.70)#78 | 38.2%(-0.300)#3,822 |
| 79. | Walled Lake | 37.8% | 36.2%(+1.60)#79 | 38.2%(-0.400)#3,854 |
| 80. | Niles | 37.7% | 36.2%(+1.50)#80 | 38.2%(-0.500)#3,877 |
| 81. | Lapeer | 37.7% | 36.2%(+1.50)#81 | 38.2%(-0.500)#3,879 |
| 82. | Farmington | 37.6% | 36.2%(+1.40)#82 | 38.2%(-0.600)#3,904 |
| 83. | Bay City | 37.4% | 36.2%(+1.20)#83 | 38.2%(-0.800)#3,947 |
| 84. | Harper Woods | 37.2% | 36.2%(+1.00)#84 | 38.2%(-1.000)#3,991 |
| 85. | Lansing | 37.1% | 36.2%(+0.900)#85 | 38.2%(-1.10)#4,004 |
| 86. | Sterling Heights | 36.9% | 36.2%(+0.700)#86 | 38.2%(-1.30)#4,053 |
| 87. | Hamtramck | 36.8% | 36.2%(+0.600)#87 | 38.2%(-1.40)#4,084 |
| 88. | Fraser | 36.6% | 36.2%(+0.400)#88 | 38.2%(-1.60)#4,133 |
| 89. | Lake Orion | 36.6% | 36.2%(+0.400)#89 | 38.2%(-1.60)#4,143 |
| 90. | Almont | 36.4% | 36.2%(+0.200)#90 | 38.2%(-1.80)#4,205 |
| 91. | Battle Creek | 36.3% | 36.2%(+0.100)#91 | 38.2%(-1.90)#4,210 |
| 92. | Muskegon | 36.1% | 36.2%(-0.100)#92 | 38.2%(-2.10)#4,255 |
| 93. | Detroit | 35.6% | 36.2%(-0.600)#93 | 38.2%(-2.60)#4,377 |
| 94. | Charlevoix | 35.6% | 36.2%(-0.600)#94 | 38.2%(-2.60)#4,400 |
| 95. | Holland | 35.5% | 36.2%(-0.700)#95 | 38.2%(-2.70)#4,408 |
| 96. | Alma | 35.5% | 36.2%(-0.700)#96 | 38.2%(-2.70)#4,418 |
| 97. | Madison Heights | 35.4% | 36.2%(-0.800)#97 | 38.2%(-2.80)#4,435 |
| 98. | Fremont | 35.2% | 36.2%(-1.00)#98 | 38.2%(-3.00)#4,486 |
| 99. | Burton | 34.5% | 36.2%(-1.70)#99 | 38.2%(-3.70)#4,630 |
| 100. | Sturgis | 34.3% | 36.2%(-1.90)#100 | 38.2%(-3.90)#4,683 |
Common Questions
What are the Top 10 Cities with the Highest Percentage of Population Taking Taxi / Cab to Work in Michigan?
Top 10 Cities with the Highest Percentage of Population Taking Taxi / Cab to Work in Michigan are:
#1
64.6%
#2
62.5%
#3
62.1%
#4
59.9%
#5
59.8%
#6
59.7%
#7
59.3%
#8
59.3%
#9
58.5%
#10
58.4%
What city has the Highest Percentage of Population Taking Taxi / Cab to Work in Michigan?
Haslett has the Highest Percentage of Population Taking Taxi / Cab to Work in Michigan with 64.6%.
What is the Percentage of Population Taking Taxi / Cab to Work in the State of Michigan?
Percentage of Population Taking Taxi / Cab to Work in Michigan is 36.2%.
What is the Percentage of Population Taking Taxi / Cab to Work in the United States?
Percentage of Population Taking Taxi / Cab to Work in the United States is 38.2%.