Cities with the Highest Percentage of Population Taking Taxi / Cab to Work in Massachusetts
RELATED REPORTS & OPTIONS
Taxi / Cab
Massachusetts
Compare Cities
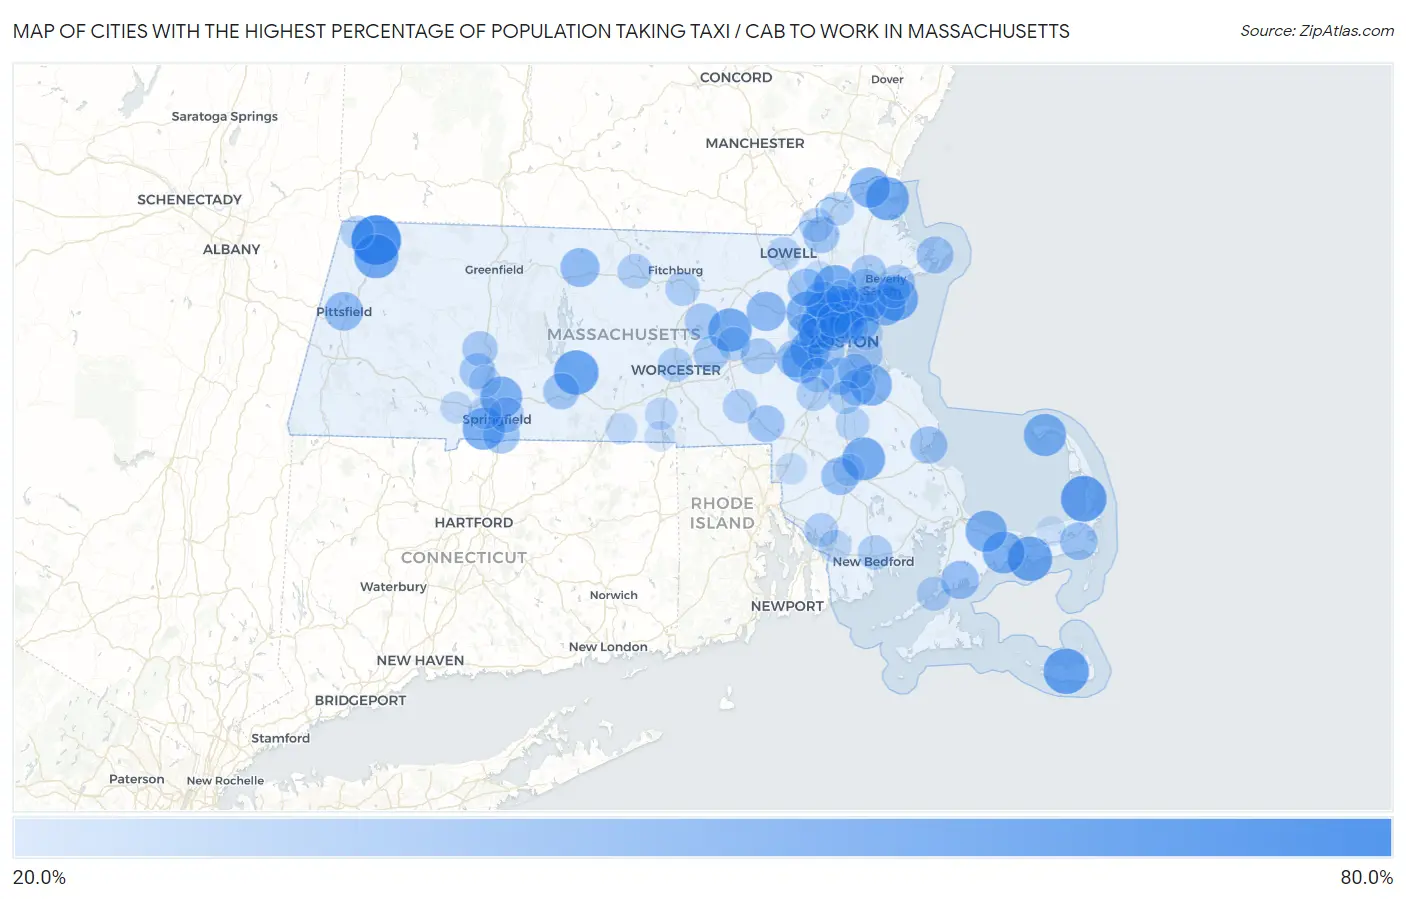
Map of Cities with the Highest Percentage of Population Taking Taxi / Cab to Work in Massachusetts
0.0%
80.0%
Cities with the Highest Percentage of Population Taking Taxi / Cab to Work in Massachusetts
| City | % Take Taxi / Cab | vs State | vs National | |
| 1. | North Adams | 71.3% | 35.1%(+36.2)#1 | 38.2%(+33.1)#20 |
| 2. | North Eastham | 61.5% | 35.1%(+26.4)#2 | 38.2%(+23.3)#266 |
| 3. | Nantucket | 61.0% | 35.1%(+25.9)#3 | 38.2%(+22.8)#303 |
| 4. | Ware | 58.6% | 35.1%(+23.5)#4 | 38.2%(+20.4)#464 |
| 5. | West Yarmouth | 57.9% | 35.1%(+22.8)#5 | 38.2%(+19.7)#542 |
| 6. | Adams | 57.3% | 35.1%(+22.2)#6 | 38.2%(+19.1)#599 |
| 7. | Marblehead | 56.0% | 35.1%(+20.9)#7 | 38.2%(+17.8)#724 |
| 8. | Hudson | 55.2% | 35.1%(+20.1)#8 | 38.2%(+17.0)#825 |
| 9. | Newburyport | 54.5% | 35.1%(+19.4)#9 | 38.2%(+16.3)#896 |
| 10. | Bridgewater Town | 53.8% | 35.1%(+18.7)#10 | 38.2%(+15.6)#987 |
| 11. | Reading | 53.4% | 35.1%(+18.3)#11 | 38.2%(+15.2)#1,024 |
| 12. | Provincetown | 52.5% | 35.1%(+17.4)#12 | 38.2%(+14.3)#1,123 |
| 13. | Agawam Town | 52.0% | 35.1%(+16.9)#13 | 38.2%(+13.8)#1,196 |
| 14. | Barnstable Town | 51.9% | 35.1%(+16.8)#14 | 38.2%(+13.7)#1,205 |
| 15. | Lexington | 51.9% | 35.1%(+16.8)#15 | 38.2%(+13.7)#1,206 |
| 16. | Melrose | 51.9% | 35.1%(+16.8)#16 | 38.2%(+13.7)#1,207 |
| 17. | Chicopee | 51.6% | 35.1%(+16.5)#17 | 38.2%(+13.4)#1,236 |
| 18. | East Sandwich | 50.4% | 35.1%(+15.3)#18 | 38.2%(+12.2)#1,425 |
| 19. | Weymouth Town | 50.3% | 35.1%(+15.2)#19 | 38.2%(+12.1)#1,429 |
| 20. | Swampscott | 49.6% | 35.1%(+14.5)#20 | 38.2%(+11.4)#1,530 |
| 21. | Needham | 49.0% | 35.1%(+13.9)#21 | 38.2%(+10.8)#1,644 |
| 22. | Amesbury Town | 48.1% | 35.1%(+13.0)#22 | 38.2%(+9.90)#1,820 |
| 23. | Saugus | 47.1% | 35.1%(+12.0)#23 | 38.2%(+8.90)#1,997 |
| 24. | Newton | 46.7% | 35.1%(+11.6)#24 | 38.2%(+8.50)#2,052 |
| 25. | West Concord | 45.4% | 35.1%(+10.3)#25 | 38.2%(+7.20)#2,270 |
| 26. | Belmont | 45.2% | 35.1%(+10.1)#26 | 38.2%(+7.00)#2,303 |
| 27. | Athol | 44.3% | 35.1%(+9.20)#27 | 38.2%(+6.10)#2,447 |
| 28. | Revere | 43.6% | 35.1%(+8.50)#28 | 38.2%(+5.40)#2,562 |
| 29. | Stoneham | 43.6% | 35.1%(+8.50)#29 | 38.2%(+5.40)#2,566 |
| 30. | Pittsfield | 43.4% | 35.1%(+8.30)#30 | 38.2%(+5.20)#2,611 |
| 31. | Winchester | 43.4% | 35.1%(+8.30)#31 | 38.2%(+5.20)#2,618 |
| 32. | East Falmouth | 41.8% | 35.1%(+6.70)#32 | 38.2%(+3.60)#2,928 |
| 33. | Arlington | 41.4% | 35.1%(+6.30)#33 | 38.2%(+3.20)#3,013 |
| 34. | Wellesley | 40.9% | 35.1%(+5.80)#34 | 38.2%(+2.70)#3,114 |
| 35. | Taunton | 40.8% | 35.1%(+5.70)#35 | 38.2%(+2.60)#3,132 |
| 36. | East Harwich | 40.6% | 35.1%(+5.50)#36 | 38.2%(+2.40)#3,190 |
| 37. | Woburn | 40.3% | 35.1%(+5.20)#37 | 38.2%(+2.10)#3,256 |
| 38. | Pinehurst | 40.2% | 35.1%(+5.10)#38 | 38.2%(+2.00)#3,296 |
| 39. | Milton | 39.9% | 35.1%(+4.80)#39 | 38.2%(+1.70)#3,357 |
| 40. | South Duxbury | 39.4% | 35.1%(+4.30)#40 | 38.2%(+1.20)#3,490 |
| 41. | Gloucester | 39.2% | 35.1%(+4.10)#41 | 38.2%(+1.00)#3,523 |
| 42. | Longmeadow | 38.9% | 35.1%(+3.80)#42 | 38.2%(+0.700)#3,583 |
| 43. | Watertown Town | 38.8% | 35.1%(+3.70)#43 | 38.2%(+0.600)#3,605 |
| 44. | Franklin Town | 38.7% | 35.1%(+3.60)#44 | 38.2%(+0.500)#3,622 |
| 45. | Brookline | 38.3% | 35.1%(+3.20)#45 | 38.2%(+0.100)#3,728 |
| 46. | Braintree Town | 38.0% | 35.1%(+2.90)#46 | 38.2%(-0.200)#3,797 |
| 47. | Everett | 37.8% | 35.1%(+2.70)#47 | 38.2%(-0.400)#3,844 |
| 48. | Lawrence | 37.5% | 35.1%(+2.40)#48 | 38.2%(-0.700)#3,913 |
| 49. | Palmer Town | 37.4% | 35.1%(+2.30)#49 | 38.2%(-0.800)#3,952 |
| 50. | Easthampton Town | 36.8% | 35.1%(+1.70)#50 | 38.2%(-1.40)#4,092 |
| 51. | Framingham | 36.1% | 35.1%(+1.000)#51 | 38.2%(-2.10)#4,252 |
| 52. | Clinton | 36.1% | 35.1%(+1.000)#52 | 38.2%(-2.10)#4,264 |
| 53. | Malden | 35.6% | 35.1%(+0.500)#53 | 38.2%(-2.60)#4,380 |
| 54. | Northborough | 35.6% | 35.1%(+0.500)#54 | 38.2%(-2.60)#4,397 |
| 55. | Lynn | 35.3% | 35.1%(+0.200)#55 | 38.2%(-2.90)#4,452 |
| 56. | Springfield | 35.2% | 35.1%(+0.100)#56 | 38.2%(-3.00)#4,475 |
| 57. | Northampton | 35.2% | 35.1%(+0.100)#57 | 38.2%(-3.00)#4,481 |
| 58. | Beverly | 35.0% | 35.1%(-0.100)#58 | 38.2%(-3.20)#4,516 |
| 59. | Boston | 34.7% | 35.1%(-0.400)#59 | 38.2%(-3.50)#4,570 |
| 60. | Danvers | 34.7% | 35.1%(-0.400)#60 | 38.2%(-3.50)#4,581 |
| 61. | Peabody | 34.5% | 35.1%(-0.600)#61 | 38.2%(-3.70)#4,625 |
| 62. | Quincy | 34.0% | 35.1%(-1.10)#62 | 38.2%(-4.20)#4,729 |
| 63. | Cambridge | 33.6% | 35.1%(-1.50)#63 | 38.2%(-4.60)#4,808 |
| 64. | Gardner | 33.3% | 35.1%(-1.80)#64 | 38.2%(-4.90)#4,875 |
| 65. | New Bedford | 33.1% | 35.1%(-2.00)#65 | 38.2%(-5.10)#4,901 |
| 66. | Dedham | 32.6% | 35.1%(-2.50)#66 | 38.2%(-5.60)#5,006 |
| 67. | Leominster | 32.5% | 35.1%(-2.60)#67 | 38.2%(-5.70)#5,020 |
| 68. | Worcester | 32.4% | 35.1%(-2.70)#68 | 38.2%(-5.80)#5,038 |
| 69. | Norwood | 32.3% | 35.1%(-2.80)#69 | 38.2%(-5.90)#5,067 |
| 70. | Milford | 32.3% | 35.1%(-2.80)#70 | 38.2%(-5.90)#5,068 |
| 71. | Woods Hole | 31.9% | 35.1%(-3.20)#71 | 38.2%(-6.30)#5,148 |
| 72. | Methuen Town | 31.8% | 35.1%(-3.30)#72 | 38.2%(-6.40)#5,157 |
| 73. | Somerset | 31.8% | 35.1%(-3.30)#73 | 38.2%(-6.40)#5,163 |
| 74. | Somerville | 31.5% | 35.1%(-3.60)#74 | 38.2%(-6.70)#5,218 |
| 75. | Chelsea | 31.2% | 35.1%(-3.90)#75 | 38.2%(-7.00)#5,272 |
| 76. | Greenfield | 31.2% | 35.1%(-3.90)#76 | 38.2%(-7.00)#5,277 |
| 77. | Williamstown | 31.2% | 35.1%(-3.90)#77 | 38.2%(-7.00)#5,284 |
| 78. | Brockton | 31.0% | 35.1%(-4.10)#78 | 38.2%(-7.20)#5,305 |
| 79. | Salem | 30.9% | 35.1%(-4.20)#79 | 38.2%(-7.30)#5,320 |
| 80. | Haverhill | 30.8% | 35.1%(-4.30)#80 | 38.2%(-7.40)#5,339 |
| 81. | Medford | 30.8% | 35.1%(-4.30)#81 | 38.2%(-7.40)#5,340 |
| 82. | Randolph Town | 30.7% | 35.1%(-4.40)#82 | 38.2%(-7.50)#5,365 |
| 83. | Marlborough | 30.6% | 35.1%(-4.50)#83 | 38.2%(-7.60)#5,398 |
| 84. | Lowell | 30.1% | 35.1%(-5.00)#84 | 38.2%(-8.10)#5,472 |
| 85. | West Springfield Town | 29.8% | 35.1%(-5.30)#85 | 38.2%(-8.40)#5,522 |
| 86. | North Attleborough | 29.7% | 35.1%(-5.40)#86 | 38.2%(-8.50)#5,546 |
| 87. | Winthrop Town | 29.0% | 35.1%(-6.10)#87 | 38.2%(-9.20)#5,674 |
| 88. | Fall River | 28.8% | 35.1%(-6.30)#88 | 38.2%(-9.40)#5,696 |
| 89. | Amherst | 28.8% | 35.1%(-6.30)#89 | 38.2%(-9.40)#5,700 |
| 90. | Wakefield | 28.2% | 35.1%(-6.90)#90 | 38.2%(-10.0)#5,788 |
| 91. | Raynham Center | 28.2% | 35.1%(-6.90)#91 | 38.2%(-10.0)#5,794 |
| 92. | Oxford | 27.6% | 35.1%(-7.50)#92 | 38.2%(-10.6)#5,874 |
| 93. | Holyoke | 27.1% | 35.1%(-8.00)#93 | 38.2%(-11.1)#5,931 |
| 94. | Waltham | 27.0% | 35.1%(-8.10)#94 | 38.2%(-11.2)#5,938 |
| 95. | Westfield | 26.6% | 35.1%(-8.50)#95 | 38.2%(-11.6)#6,002 |
| 96. | Southbridge Town | 26.2% | 35.1%(-8.90)#96 | 38.2%(-12.0)#6,049 |
| 97. | Attleboro | 25.5% | 35.1%(-9.60)#97 | 38.2%(-12.7)#6,125 |
| 98. | Wilmington | 24.8% | 35.1%(-10.3)#98 | 38.2%(-13.4)#6,211 |
| 99. | Webster | 23.4% | 35.1%(-11.7)#99 | 38.2%(-14.8)#6,381 |
| 100. | East Dennis | 21.9% | 35.1%(-13.2)#100 | 38.2%(-16.3)#6,507 |
Common Questions
What are the Top 10 Cities with the Highest Percentage of Population Taking Taxi / Cab to Work in Massachusetts?
Top 10 Cities with the Highest Percentage of Population Taking Taxi / Cab to Work in Massachusetts are:
#1
71.3%
#2
61.5%
#3
61.0%
#4
58.6%
#5
57.9%
#6
57.3%
#7
56.0%
#8
55.2%
#9
54.5%
#10
53.8%
What city has the Highest Percentage of Population Taking Taxi / Cab to Work in Massachusetts?
North Adams has the Highest Percentage of Population Taking Taxi / Cab to Work in Massachusetts with 71.3%.
What is the Percentage of Population Taking Taxi / Cab to Work in the State of Massachusetts?
Percentage of Population Taking Taxi / Cab to Work in Massachusetts is 35.1%.
What is the Percentage of Population Taking Taxi / Cab to Work in the United States?
Percentage of Population Taking Taxi / Cab to Work in the United States is 38.2%.