Cities with the Highest Percentage of Population Taking Taxi / Cab to Work in Pennsylvania
RELATED REPORTS & OPTIONS
Taxi / Cab
Pennsylvania
Compare Cities
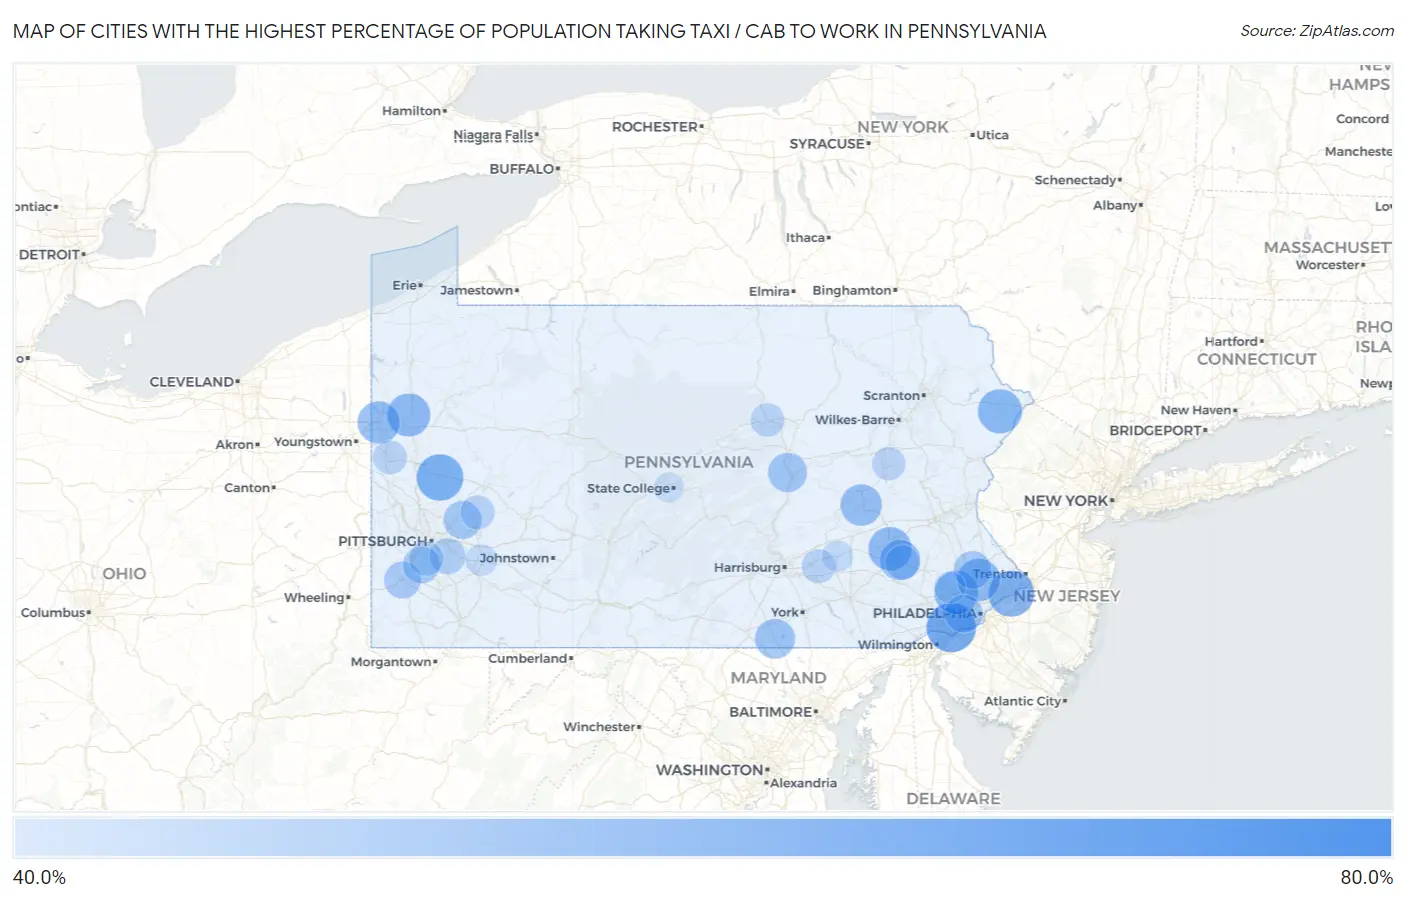
Map of Cities with the Highest Percentage of Population Taking Taxi / Cab to Work in Pennsylvania
0.0%
80.0%
Cities with the Highest Percentage of Population Taking Taxi / Cab to Work in Pennsylvania
| City | % Take Taxi / Cab | vs State | vs National | |
| 1. | Millvale Borough | 71.2% | 37.5%(+33.7)#1 | 38.2%(+33.0)#24 |
| 2. | Roslyn | 69.5% | 37.5%(+32.0)#2 | 38.2%(+31.3)#40 |
| 3. | New Salem Borough | 67.1% | 37.5%(+29.6)#3 | 38.2%(+28.9)#83 |
| 4. | Prospect Borough | 66.1% | 37.5%(+28.6)#4 | 38.2%(+27.9)#99 |
| 5. | New Stanton Borough | 65.0% | 37.5%(+27.5)#5 | 38.2%(+26.8)#117 |
| 6. | New Beaver Borough | 64.5% | 37.5%(+27.0)#6 | 38.2%(+26.3)#130 |
| 7. | Shoemakersville Borough | 64.1% | 37.5%(+26.6)#7 | 38.2%(+25.9)#152 |
| 8. | Hayti | 63.3% | 37.5%(+25.8)#8 | 38.2%(+25.1)#179 |
| 9. | Village Green Green Ridge | 63.2% | 37.5%(+25.7)#9 | 38.2%(+25.0)#184 |
| 10. | Beaver Borough | 62.1% | 37.5%(+24.6)#10 | 38.2%(+23.9)#236 |
| 11. | Economy Borough | 61.6% | 37.5%(+24.1)#11 | 38.2%(+23.4)#259 |
| 12. | Tremont Borough | 61.3% | 37.5%(+23.8)#12 | 38.2%(+23.1)#280 |
| 13. | Hydetown Borough | 60.5% | 37.5%(+23.0)#13 | 38.2%(+22.3)#322 |
| 14. | Homeacre Lyndora | 60.2% | 37.5%(+22.7)#14 | 38.2%(+22.0)#346 |
| 15. | Croydon | 59.3% | 37.5%(+21.8)#15 | 38.2%(+21.1)#414 |
| 16. | Lewistown Borough | 59.2% | 37.5%(+21.7)#16 | 38.2%(+21.0)#429 |
| 17. | Gallitzin Borough | 58.3% | 37.5%(+20.8)#17 | 38.2%(+20.1)#504 |
| 18. | Centerville Borough Washington County | 58.1% | 37.5%(+20.6)#18 | 38.2%(+19.9)#526 |
| 19. | Morrisville Borough | 57.6% | 37.5%(+20.1)#19 | 38.2%(+19.4)#564 |
| 20. | Conashaugh Lakes | 57.6% | 37.5%(+20.1)#20 | 38.2%(+19.4)#572 |
| 21. | Deer Lake Borough | 57.5% | 37.5%(+20.0)#21 | 38.2%(+19.3)#584 |
| 22. | Munhall Borough | 57.2% | 37.5%(+19.7)#22 | 38.2%(+19.0)#609 |
| 23. | King Of Prussia | 57.1% | 37.5%(+19.6)#23 | 38.2%(+18.9)#613 |
| 24. | Riverview Park | 56.7% | 37.5%(+19.2)#24 | 38.2%(+18.5)#646 |
| 25. | Lake Latonka | 56.5% | 37.5%(+19.0)#25 | 38.2%(+18.3)#666 |
| 26. | Irvona Borough | 56.5% | 37.5%(+19.0)#26 | 38.2%(+18.3)#669 |
| 27. | Maple Glen | 56.3% | 37.5%(+18.8)#27 | 38.2%(+18.1)#696 |
| 28. | Hermitage | 55.6% | 37.5%(+18.1)#28 | 38.2%(+17.4)#765 |
| 29. | New Hope Borough | 55.4% | 37.5%(+17.9)#29 | 38.2%(+17.2)#802 |
| 30. | Ford Cliff Borough | 55.0% | 37.5%(+17.5)#30 | 38.2%(+16.8)#862 |
| 31. | Pottsville | 54.8% | 37.5%(+17.3)#31 | 38.2%(+16.6)#872 |
| 32. | St. Davids | 54.7% | 37.5%(+17.2)#32 | 38.2%(+16.5)#882 |
| 33. | Dillsburg Borough | 54.4% | 37.5%(+16.9)#33 | 38.2%(+16.2)#911 |
| 34. | Reiffton | 53.9% | 37.5%(+16.4)#34 | 38.2%(+15.7)#986 |
| 35. | West Mifflin Borough | 53.5% | 37.5%(+16.0)#35 | 38.2%(+15.3)#1,012 |
| 36. | Parkville | 53.2% | 37.5%(+15.7)#36 | 38.2%(+15.0)#1,052 |
| 37. | Mount Wolf Borough | 53.2% | 37.5%(+15.7)#37 | 38.2%(+15.0)#1,053 |
| 38. | Chestnut Hill | 52.4% | 37.5%(+14.9)#38 | 38.2%(+14.2)#1,137 |
| 39. | Olyphant Borough | 52.3% | 37.5%(+14.8)#39 | 38.2%(+14.1)#1,163 |
| 40. | Winfield | 52.3% | 37.5%(+14.8)#40 | 38.2%(+14.1)#1,168 |
| 41. | Cleona Borough | 51.6% | 37.5%(+14.1)#41 | 38.2%(+13.4)#1,252 |
| 42. | Jacobus Borough | 51.5% | 37.5%(+14.0)#42 | 38.2%(+13.3)#1,266 |
| 43. | Jamestown Borough | 51.5% | 37.5%(+14.0)#43 | 38.2%(+13.3)#1,272 |
| 44. | Lower Burrell | 51.4% | 37.5%(+13.9)#44 | 38.2%(+13.2)#1,288 |
| 45. | Drexel Hill | 51.1% | 37.5%(+13.6)#45 | 38.2%(+12.9)#1,331 |
| 46. | Montgomeryville | 50.9% | 37.5%(+13.4)#46 | 38.2%(+12.7)#1,356 |
| 47. | Flemington Borough | 50.8% | 37.5%(+13.3)#47 | 38.2%(+12.6)#1,372 |
| 48. | Emmaus Borough | 50.7% | 37.5%(+13.2)#48 | 38.2%(+12.5)#1,379 |
| 49. | Bellevue Borough | 50.5% | 37.5%(+13.0)#49 | 38.2%(+12.3)#1,400 |
| 50. | Washington | 50.1% | 37.5%(+12.6)#50 | 38.2%(+11.9)#1,469 |
| 51. | Mcmurray | 50.0% | 37.5%(+12.5)#51 | 38.2%(+11.8)#1,478 |
| 52. | Loganville Borough | 49.7% | 37.5%(+12.2)#52 | 38.2%(+11.5)#1,525 |
| 53. | Mill Village Borough | 49.5% | 37.5%(+12.0)#53 | 38.2%(+11.3)#1,558 |
| 54. | Conway Borough | 49.4% | 37.5%(+11.9)#54 | 38.2%(+11.2)#1,578 |
| 55. | Kingston Borough | 49.3% | 37.5%(+11.8)#55 | 38.2%(+11.1)#1,589 |
| 56. | Fredericksburg Cdp Lebanon County | 49.3% | 37.5%(+11.8)#56 | 38.2%(+11.1)#1,604 |
| 57. | Mckeesport | 49.1% | 37.5%(+11.6)#57 | 38.2%(+10.9)#1,625 |
| 58. | Mechanicsburg Borough | 48.9% | 37.5%(+11.4)#58 | 38.2%(+10.7)#1,670 |
| 59. | Bridgewater Borough | 48.7% | 37.5%(+11.2)#59 | 38.2%(+10.5)#1,718 |
| 60. | Gettysburg Borough | 48.6% | 37.5%(+11.1)#60 | 38.2%(+10.4)#1,729 |
| 61. | Springdale Borough | 48.4% | 37.5%(+10.9)#61 | 38.2%(+10.2)#1,780 |
| 62. | Plum Borough | 48.3% | 37.5%(+10.8)#62 | 38.2%(+10.1)#1,787 |
| 63. | Elizabethtown Borough | 48.3% | 37.5%(+10.8)#63 | 38.2%(+10.1)#1,793 |
| 64. | Jefferson Hills Borough | 48.2% | 37.5%(+10.7)#64 | 38.2%(+10.0)#1,810 |
| 65. | Carnegie Borough | 48.2% | 37.5%(+10.7)#65 | 38.2%(+10.0)#1,812 |
| 66. | Lorane | 47.5% | 37.5%(+10.00)#66 | 38.2%(+9.30)#1,924 |
| 67. | Bethel Park | 47.3% | 37.5%(+9.80)#67 | 38.2%(+9.10)#1,958 |
| 68. | Hyde Park | 47.2% | 37.5%(+9.70)#68 | 38.2%(+9.00)#1,986 |
| 69. | Palmyra Borough | 47.1% | 37.5%(+9.60)#69 | 38.2%(+8.90)#2,006 |
| 70. | Campbelltown | 47.0% | 37.5%(+9.50)#70 | 38.2%(+8.80)#2,020 |
| 71. | Central City Borough | 47.0% | 37.5%(+9.50)#71 | 38.2%(+8.80)#2,022 |
| 72. | New Castle | 46.9% | 37.5%(+9.40)#72 | 38.2%(+8.70)#2,026 |
| 73. | Williamsport | 46.8% | 37.5%(+9.30)#73 | 38.2%(+8.60)#2,035 |
| 74. | Coraopolis Borough | 46.8% | 37.5%(+9.30)#74 | 38.2%(+8.60)#2,042 |
| 75. | Hanover Borough | 46.7% | 37.5%(+9.20)#75 | 38.2%(+8.50)#2,059 |
| 76. | Mckees Rocks Borough | 46.5% | 37.5%(+9.00)#76 | 38.2%(+8.30)#2,099 |
| 77. | Ebensburg Borough | 46.5% | 37.5%(+9.00)#77 | 38.2%(+8.30)#2,100 |
| 78. | Sugarcreek Borough | 46.4% | 37.5%(+8.90)#78 | 38.2%(+8.20)#2,125 |
| 79. | Hazleton | 46.3% | 37.5%(+8.80)#79 | 38.2%(+8.10)#2,134 |
| 80. | Eddystone Borough | 46.2% | 37.5%(+8.70)#80 | 38.2%(+8.00)#2,164 |
| 81. | Homer City Borough | 45.6% | 37.5%(+8.10)#81 | 38.2%(+7.40)#2,225 |
| 82. | Oakmont Borough | 45.5% | 37.5%(+8.00)#82 | 38.2%(+7.30)#2,247 |
| 83. | Spring City Borough | 45.5% | 37.5%(+8.00)#83 | 38.2%(+7.30)#2,251 |
| 84. | Hatboro Borough | 45.0% | 37.5%(+7.50)#84 | 38.2%(+6.80)#2,330 |
| 85. | Greensburg | 44.8% | 37.5%(+7.30)#85 | 38.2%(+6.60)#2,352 |
| 86. | Lebanon | 44.5% | 37.5%(+7.00)#86 | 38.2%(+6.30)#2,392 |
| 87. | Audubon | 44.5% | 37.5%(+7.00)#87 | 38.2%(+6.30)#2,398 |
| 88. | Lake City Borough | 44.5% | 37.5%(+7.00)#88 | 38.2%(+6.30)#2,406 |
| 89. | State College Borough | 44.3% | 37.5%(+6.80)#89 | 38.2%(+6.10)#2,436 |
| 90. | Duncannon Borough | 44.2% | 37.5%(+6.70)#90 | 38.2%(+6.00)#2,473 |
| 91. | Ferndale Borough | 43.9% | 37.5%(+6.40)#91 | 38.2%(+5.70)#2,527 |
| 92. | Wrightsville Borough | 43.6% | 37.5%(+6.10)#92 | 38.2%(+5.40)#2,575 |
| 93. | North York Borough | 43.5% | 37.5%(+6.00)#93 | 38.2%(+5.30)#2,599 |
| 94. | Millbourne Borough | 43.3% | 37.5%(+5.80)#94 | 38.2%(+5.10)#2,644 |
| 95. | Park Forest Village | 43.2% | 37.5%(+5.70)#95 | 38.2%(+5.00)#2,663 |
| 96. | Frackville Borough | 43.2% | 37.5%(+5.70)#96 | 38.2%(+5.00)#2,665 |
| 97. | Hughestown Borough | 43.2% | 37.5%(+5.70)#97 | 38.2%(+5.00)#2,668 |
| 98. | Robesonia Borough | 43.0% | 37.5%(+5.50)#98 | 38.2%(+4.80)#2,689 |
| 99. | Clarendon Borough | 43.0% | 37.5%(+5.50)#99 | 38.2%(+4.80)#2,691 |
| 100. | Selinsgrove Borough | 42.7% | 37.5%(+5.20)#100 | 38.2%(+4.50)#2,746 |
Common Questions
What are the Top 10 Cities with the Highest Percentage of Population Taking Taxi / Cab to Work in Pennsylvania?
Top 10 Cities with the Highest Percentage of Population Taking Taxi / Cab to Work in Pennsylvania are:
#1
63.2%
#2
60.2%
#3
59.3%
#4
57.6%
#5
57.1%
#6
56.7%
#7
56.5%
#8
56.3%
#9
55.6%
#10
54.8%
What city has the Highest Percentage of Population Taking Taxi / Cab to Work in Pennsylvania?
Village Green Green Ridge has the Highest Percentage of Population Taking Taxi / Cab to Work in Pennsylvania with 63.2%.
What is the Percentage of Population Taking Taxi / Cab to Work in the State of Pennsylvania?
Percentage of Population Taking Taxi / Cab to Work in Pennsylvania is 37.5%.
What is the Percentage of Population Taking Taxi / Cab to Work in the United States?
Percentage of Population Taking Taxi / Cab to Work in the United States is 38.2%.