Cities with the Highest Percentage of Population Taking Taxi / Cab to Work in Maryland
RELATED REPORTS & OPTIONS
Taxi / Cab
Maryland
Compare Cities
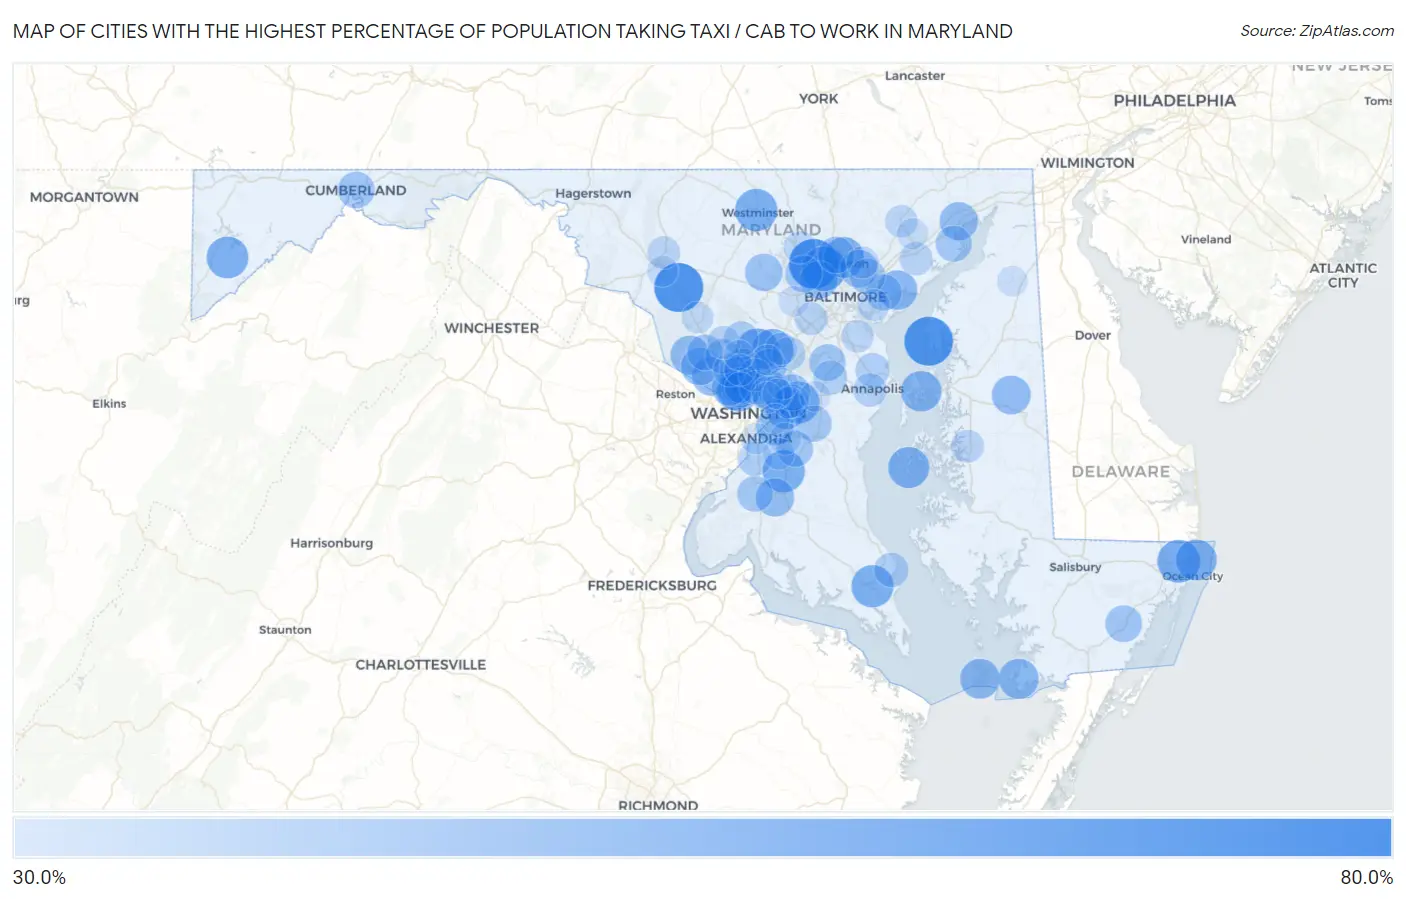
Map of Cities with the Highest Percentage of Population Taking Taxi / Cab to Work in Maryland
0.0%
80.0%
Cities with the Highest Percentage of Population Taking Taxi / Cab to Work in Maryland
| City | % Take Taxi / Cab | vs State | vs National | |
| 1. | Garrison | 70.1% | 38.6%(+31.5)#1 | 38.2%(+31.9)#36 |
| 2. | Urbana | 69.3% | 38.6%(+30.7)#2 | 38.2%(+31.1)#45 |
| 3. | Rock Hall | 68.9% | 38.6%(+30.3)#3 | 38.2%(+30.7)#53 |
| 4. | Honeygo | 64.2% | 38.6%(+25.6)#4 | 38.2%(+26.0)#142 |
| 5. | Pikesville | 62.1% | 38.6%(+23.5)#5 | 38.2%(+23.9)#232 |
| 6. | Cloverly | 59.5% | 38.6%(+20.9)#6 | 38.2%(+21.3)#388 |
| 7. | Ocean Pines | 59.2% | 38.6%(+20.6)#7 | 38.2%(+21.0)#425 |
| 8. | California | 58.2% | 38.6%(+19.6)#8 | 38.2%(+20.0)#508 |
| 9. | Brandywine | 58.2% | 38.6%(+19.6)#9 | 38.2%(+20.0)#513 |
| 10. | Westminster | 58.1% | 38.6%(+19.5)#10 | 38.2%(+19.9)#522 |
| 11. | Burtonsville | 57.8% | 38.6%(+19.2)#11 | 38.2%(+19.6)#548 |
| 12. | Deer Park | 57.5% | 38.6%(+18.9)#12 | 38.2%(+19.3)#587 |
| 13. | Mitchellville | 57.4% | 38.6%(+18.8)#13 | 38.2%(+19.2)#588 |
| 14. | Ocean City | 56.4% | 38.6%(+17.8)#14 | 38.2%(+18.2)#681 |
| 15. | Tilghman Island | 56.4% | 38.6%(+17.8)#15 | 38.2%(+18.2)#686 |
| 16. | Summerfield | 55.8% | 38.6%(+17.2)#16 | 38.2%(+17.6)#743 |
| 17. | Lutherville | 55.8% | 38.6%(+17.2)#17 | 38.2%(+17.6)#748 |
| 18. | Chevy Chase | 55.5% | 38.6%(+16.9)#18 | 38.2%(+17.3)#777 |
| 19. | Chester | 55.5% | 38.6%(+16.9)#19 | 38.2%(+17.3)#781 |
| 20. | Chevy Chase Village | 55.3% | 38.6%(+16.7)#20 | 38.2%(+17.1)#817 |
| 21. | Crisfield | 54.4% | 38.6%(+15.8)#21 | 38.2%(+16.2)#912 |
| 22. | Martin S Additions | 54.3% | 38.6%(+15.7)#22 | 38.2%(+16.1)#932 |
| 23. | University Park | 54.2% | 38.6%(+15.6)#23 | 38.2%(+16.0)#944 |
| 24. | Smith Island | 54.2% | 38.6%(+15.6)#24 | 38.2%(+16.0)#948 |
| 25. | Bowleys Quarters | 53.8% | 38.6%(+15.2)#25 | 38.2%(+15.6)#991 |
| 26. | Kensington | 53.8% | 38.6%(+15.2)#26 | 38.2%(+15.6)#995 |
| 27. | Darnestown | 53.0% | 38.6%(+14.4)#27 | 38.2%(+14.8)#1,078 |
| 28. | Ridgely | 52.7% | 38.6%(+14.1)#28 | 38.2%(+14.5)#1,102 |
| 29. | Potomac | 52.3% | 38.6%(+13.7)#29 | 38.2%(+14.1)#1,147 |
| 30. | Flower Hill | 52.2% | 38.6%(+13.6)#30 | 38.2%(+14.0)#1,173 |
| 31. | Havre De Grace | 51.8% | 38.6%(+13.2)#31 | 38.2%(+13.6)#1,219 |
| 32. | Waldorf | 51.7% | 38.6%(+13.1)#32 | 38.2%(+13.5)#1,226 |
| 33. | Somerset | 51.5% | 38.6%(+12.9)#33 | 38.2%(+13.3)#1,269 |
| 34. | Travilah | 51.3% | 38.6%(+12.7)#34 | 38.2%(+13.1)#1,305 |
| 35. | Lochearn | 51.1% | 38.6%(+12.5)#35 | 38.2%(+12.9)#1,332 |
| 36. | Parkville | 51.0% | 38.6%(+12.4)#36 | 38.2%(+12.8)#1,344 |
| 37. | Suitland | 50.7% | 38.6%(+12.1)#37 | 38.2%(+12.5)#1,376 |
| 38. | Wheaton | 50.6% | 38.6%(+12.0)#38 | 38.2%(+12.4)#1,383 |
| 39. | Sykesville | 50.6% | 38.6%(+12.0)#39 | 38.2%(+12.4)#1,391 |
| 40. | Woodlawn Cdp Prince George S County | 50.3% | 38.6%(+11.7)#40 | 38.2%(+12.1)#1,439 |
| 41. | Randallstown | 49.6% | 38.6%(+11.0)#41 | 38.2%(+11.4)#1,527 |
| 42. | Chevy Chase Section Five | 49.5% | 38.6%(+10.9)#42 | 38.2%(+11.3)#1,556 |
| 43. | Snow Hill | 49.3% | 38.6%(+10.7)#43 | 38.2%(+11.1)#1,600 |
| 44. | Cumberland | 49.2% | 38.6%(+10.6)#44 | 38.2%(+11.0)#1,612 |
| 45. | Odenton | 49.1% | 38.6%(+10.5)#45 | 38.2%(+10.9)#1,621 |
| 46. | Mays Chapel | 49.1% | 38.6%(+10.5)#46 | 38.2%(+10.9)#1,631 |
| 47. | Bethesda | 48.9% | 38.6%(+10.3)#47 | 38.2%(+10.7)#1,663 |
| 48. | Lanham | 48.7% | 38.6%(+10.1)#48 | 38.2%(+10.5)#1,711 |
| 49. | Brock Hall | 48.5% | 38.6%(+9.90)#49 | 38.2%(+10.3)#1,747 |
| 50. | Rosaryville | 48.5% | 38.6%(+9.90)#50 | 38.2%(+10.3)#1,748 |
| 51. | Essex | 48.3% | 38.6%(+9.70)#51 | 38.2%(+10.1)#1,786 |
| 52. | Aberdeen Proving Ground | 48.3% | 38.6%(+9.70)#52 | 38.2%(+10.1)#1,796 |
| 53. | North Potomac | 47.9% | 38.6%(+9.30)#53 | 38.2%(+9.70)#1,856 |
| 54. | Bensville | 47.8% | 38.6%(+9.20)#54 | 38.2%(+9.60)#1,874 |
| 55. | Overlea | 47.5% | 38.6%(+8.90)#55 | 38.2%(+9.30)#1,922 |
| 56. | Calverton | 46.6% | 38.6%(+8.00)#56 | 38.2%(+8.40)#2,075 |
| 57. | Rockville | 46.2% | 38.6%(+7.60)#57 | 38.2%(+8.00)#2,153 |
| 58. | Olney | 46.0% | 38.6%(+7.40)#58 | 38.2%(+7.80)#2,174 |
| 59. | Fort Washington | 45.7% | 38.6%(+7.10)#59 | 38.2%(+7.50)#2,202 |
| 60. | Chesapeake Ranch Estates | 45.6% | 38.6%(+7.00)#60 | 38.2%(+7.40)#2,222 |
| 61. | Arnold | 45.2% | 38.6%(+6.60)#61 | 38.2%(+7.00)#2,304 |
| 62. | Crofton | 44.9% | 38.6%(+6.30)#62 | 38.2%(+6.70)#2,337 |
| 63. | Takoma Park | 44.6% | 38.6%(+6.00)#63 | 38.2%(+6.40)#2,374 |
| 64. | Annapolis | 44.4% | 38.6%(+5.80)#64 | 38.2%(+6.20)#2,415 |
| 65. | Laurel | 44.3% | 38.6%(+5.70)#65 | 38.2%(+6.10)#2,437 |
| 66. | North Bethesda | 43.8% | 38.6%(+5.20)#66 | 38.2%(+5.60)#2,531 |
| 67. | Springdale | 43.8% | 38.6%(+5.20)#67 | 38.2%(+5.60)#2,541 |
| 68. | Edgewood | 43.6% | 38.6%(+5.00)#68 | 38.2%(+5.40)#2,565 |
| 69. | Redland | 43.6% | 38.6%(+5.00)#69 | 38.2%(+5.40)#2,567 |
| 70. | Ilchester | 43.5% | 38.6%(+4.90)#70 | 38.2%(+5.30)#2,587 |
| 71. | Easton | 43.4% | 38.6%(+4.80)#71 | 38.2%(+5.20)#2,621 |
| 72. | Four Corners | 43.4% | 38.6%(+4.80)#72 | 38.2%(+5.20)#2,623 |
| 73. | Riverdale Park | 43.3% | 38.6%(+4.70)#73 | 38.2%(+5.10)#2,638 |
| 74. | Frederick | 43.2% | 38.6%(+4.60)#74 | 38.2%(+5.00)#2,649 |
| 75. | Pasadena | 42.6% | 38.6%(+4.00)#75 | 38.2%(+4.40)#2,754 |
| 76. | Bel Air North | 42.5% | 38.6%(+3.90)#76 | 38.2%(+4.30)#2,781 |
| 77. | Reisterstown | 42.5% | 38.6%(+3.90)#77 | 38.2%(+4.30)#2,782 |
| 78. | Hyattsville | 42.3% | 38.6%(+3.70)#78 | 38.2%(+4.10)#2,829 |
| 79. | West Laurel | 42.2% | 38.6%(+3.60)#79 | 38.2%(+4.00)#2,862 |
| 80. | Carney | 42.0% | 38.6%(+3.40)#80 | 38.2%(+3.80)#2,883 |
| 81. | Dundalk | 41.9% | 38.6%(+3.30)#81 | 38.2%(+3.70)#2,895 |
| 82. | Andrews Afb | 41.9% | 38.6%(+3.30)#82 | 38.2%(+3.70)#2,910 |
| 83. | Clinton | 41.5% | 38.6%(+2.90)#83 | 38.2%(+3.30)#2,981 |
| 84. | Clarksburg | 41.5% | 38.6%(+2.90)#84 | 38.2%(+3.30)#2,983 |
| 85. | Glenarden | 41.3% | 38.6%(+2.70)#85 | 38.2%(+3.10)#3,053 |
| 86. | Greenbelt | 41.0% | 38.6%(+2.40)#86 | 38.2%(+2.80)#3,097 |
| 87. | North Kensington | 41.0% | 38.6%(+2.40)#87 | 38.2%(+2.80)#3,101 |
| 88. | Bel Air South | 40.6% | 38.6%(+2.00)#88 | 38.2%(+2.40)#3,180 |
| 89. | Brentwood | 40.6% | 38.6%(+2.00)#89 | 38.2%(+2.40)#3,192 |
| 90. | Ballenger Creek | 40.3% | 38.6%(+1.70)#90 | 38.2%(+2.10)#3,257 |
| 91. | Forest Heights | 40.3% | 38.6%(+1.70)#91 | 38.2%(+2.10)#3,270 |
| 92. | Fairland | 39.7% | 38.6%(+1.10)#92 | 38.2%(+1.50)#3,400 |
| 93. | Chevy Chase Section Three | 39.7% | 38.6%(+1.10)#93 | 38.2%(+1.50)#3,413 |
| 94. | Galena | 39.7% | 38.6%(+1.10)#94 | 38.2%(+1.50)#3,415 |
| 95. | Bowie | 39.6% | 38.6%(+1.00)#95 | 38.2%(+1.40)#3,418 |
| 96. | Ellicott City | 39.5% | 38.6%(+0.900)#96 | 38.2%(+1.30)#3,442 |
| 97. | Woodlawn Cdp Baltimore County | 39.5% | 38.6%(+0.900)#97 | 38.2%(+1.30)#3,446 |
| 98. | East Riverdale | 39.2% | 38.6%(+0.600)#98 | 38.2%(+1.00)#3,525 |
| 99. | Aspen Hill | 39.0% | 38.6%(+0.400)#99 | 38.2%(+0.800)#3,564 |
| 100. | Coral Hills | 39.0% | 38.6%(+0.400)#100 | 38.2%(+0.800)#3,569 |
Common Questions
What are the Top 10 Cities with the Highest Percentage of Population Taking Taxi / Cab to Work in Maryland?
Top 10 Cities with the Highest Percentage of Population Taking Taxi / Cab to Work in Maryland are:
#1
70.1%
#2
69.3%
#3
68.9%
#4
62.1%
#5
59.5%
#6
59.2%
#7
58.2%
#8
58.2%
#9
58.1%
#10
57.8%
What city has the Highest Percentage of Population Taking Taxi / Cab to Work in Maryland?
Garrison has the Highest Percentage of Population Taking Taxi / Cab to Work in Maryland with 70.1%.
What is the Percentage of Population Taking Taxi / Cab to Work in the State of Maryland?
Percentage of Population Taking Taxi / Cab to Work in Maryland is 38.6%.
What is the Percentage of Population Taking Taxi / Cab to Work in the United States?
Percentage of Population Taking Taxi / Cab to Work in the United States is 38.2%.