Zip Codes with the Highest Percentage of Population Taking Taxi / Cab to Work in Paterson, NJ
RELATED REPORTS & OPTIONS
Taxi / Cab
Paterson
Compare Zip Codes
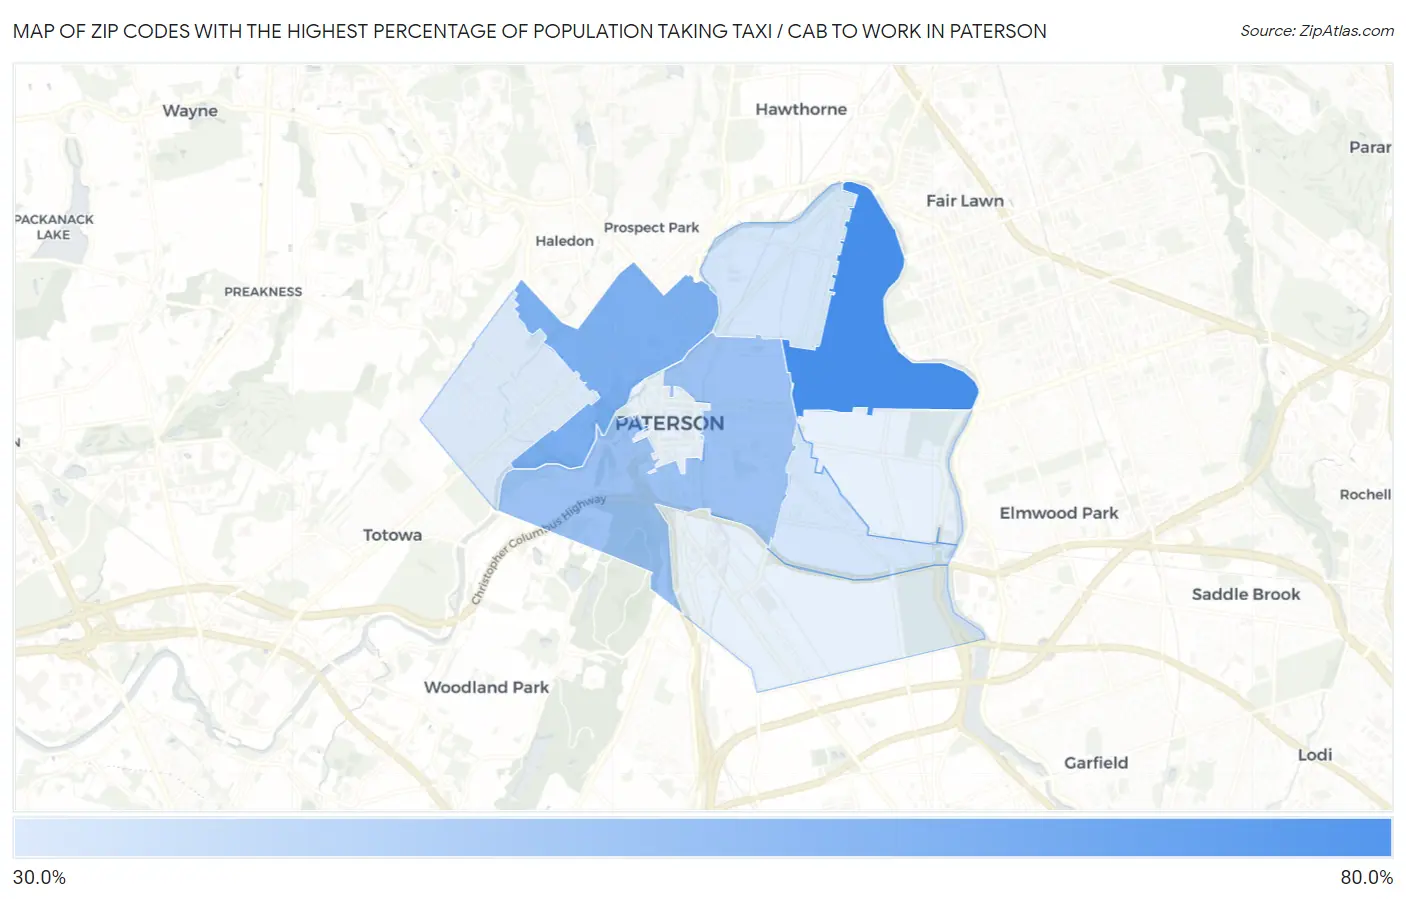
Map of Zip Codes with the Highest Percentage of Population Taking Taxi / Cab to Work in Paterson
32.0%
68.6%
Zip Codes with the Highest Percentage of Population Taking Taxi / Cab to Work in Paterson, NJ
| Zip Code | % Take Taxi / Cab | vs State | vs National | |
| 1. | 07514 | 68.6% | 39.4%(+29.2)#7 | 38.2%(+30.4)#109 |
| 2. | 07522 | 54.2% | 39.4%(+14.8)#53 | 38.2%(+16.0)#1,794 |
| 3. | 07501 | 46.5% | 39.4%(+7.10)#130 | 38.2%(+8.30)#4,108 |
| 4. | 07513 | 34.1% | 39.4%(-5.30)#290 | 38.2%(-4.10)#9,318 |
| 5. | 07524 | 33.8% | 39.4%(-5.60)#294 | 38.2%(-4.40)#9,449 |
| 6. | 07502 | 32.0% | 39.4%(-7.40)#311 | 38.2%(-6.20)#10,163 |
1
Common Questions
What are the Top 5 Zip Codes with the Highest Percentage of Population Taking Taxi / Cab to Work in Paterson, NJ?
Top 5 Zip Codes with the Highest Percentage of Population Taking Taxi / Cab to Work in Paterson, NJ are:
What zip code has the Highest Percentage of Population Taking Taxi / Cab to Work in Paterson, NJ?
07514 has the Highest Percentage of Population Taking Taxi / Cab to Work in Paterson, NJ with 68.6%.
What is the Percentage of Population Taking Taxi / Cab to Work in Paterson, NJ?
Percentage of Population Taking Taxi / Cab to Work in Paterson is 36.8%.
What is the Percentage of Population Taking Taxi / Cab to Work in New Jersey?
Percentage of Population Taking Taxi / Cab to Work in New Jersey is 39.4%.
What is the Percentage of Population Taking Taxi / Cab to Work in the United States?
Percentage of Population Taking Taxi / Cab to Work in the United States is 38.2%.