Zip Codes with the Highest Percentage of Population Taking Taxi / Cab to Work in Vineland, NJ
RELATED REPORTS & OPTIONS
Taxi / Cab
Vineland
Compare Zip Codes
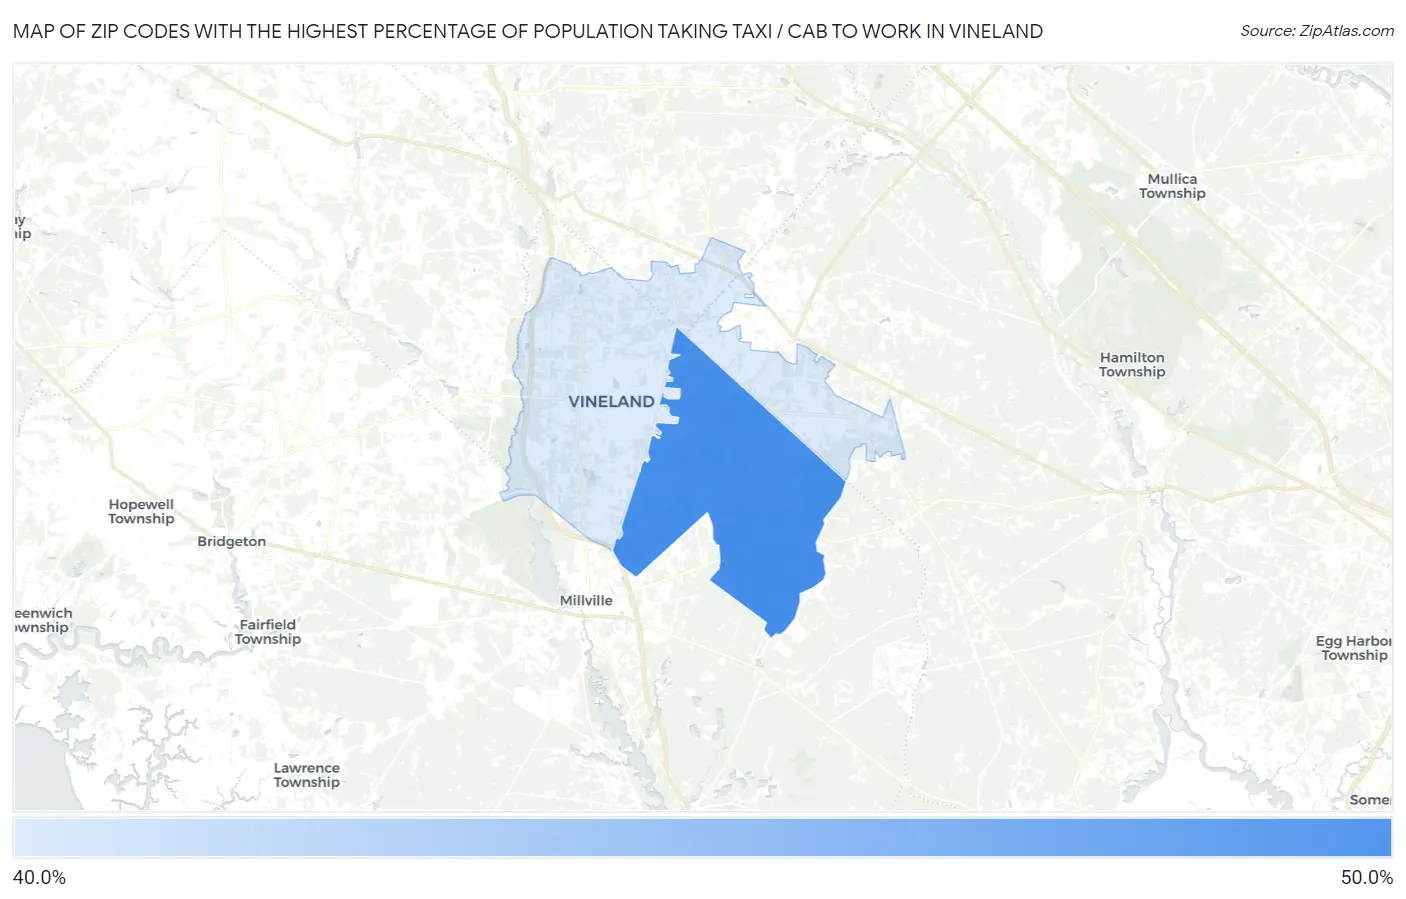
Map of Zip Codes with the Highest Percentage of Population Taking Taxi / Cab to Work in Vineland
41.3%
46.7%
Zip Codes with the Highest Percentage of Population Taking Taxi / Cab to Work in Vineland, NJ
| Zip Code | % Take Taxi / Cab | vs State | vs National | |
| 1. | 08361 | 46.7% | 39.4%(+7.30)#127 | 38.2%(+8.50)#4,042 |
| 2. | 08360 | 41.3% | 39.4%(+1.90)#184 | 38.2%(+3.10)#6,022 |
1
Common Questions
What are the Top Zip Codes with the Highest Percentage of Population Taking Taxi / Cab to Work in Vineland, NJ?
Top Zip Codes with the Highest Percentage of Population Taking Taxi / Cab to Work in Vineland, NJ are:
What zip code has the Highest Percentage of Population Taking Taxi / Cab to Work in Vineland, NJ?
08361 has the Highest Percentage of Population Taking Taxi / Cab to Work in Vineland, NJ with 46.7%.
What is the Percentage of Population Taking Taxi / Cab to Work in Vineland, NJ?
Percentage of Population Taking Taxi / Cab to Work in Vineland is 46.2%.
What is the Percentage of Population Taking Taxi / Cab to Work in New Jersey?
Percentage of Population Taking Taxi / Cab to Work in New Jersey is 39.4%.
What is the Percentage of Population Taking Taxi / Cab to Work in the United States?
Percentage of Population Taking Taxi / Cab to Work in the United States is 38.2%.