Cities with the Highest Percentage of Population Taking Taxi / Cab to Work in Illinois
RELATED REPORTS & OPTIONS
Taxi / Cab
Illinois
Compare Cities
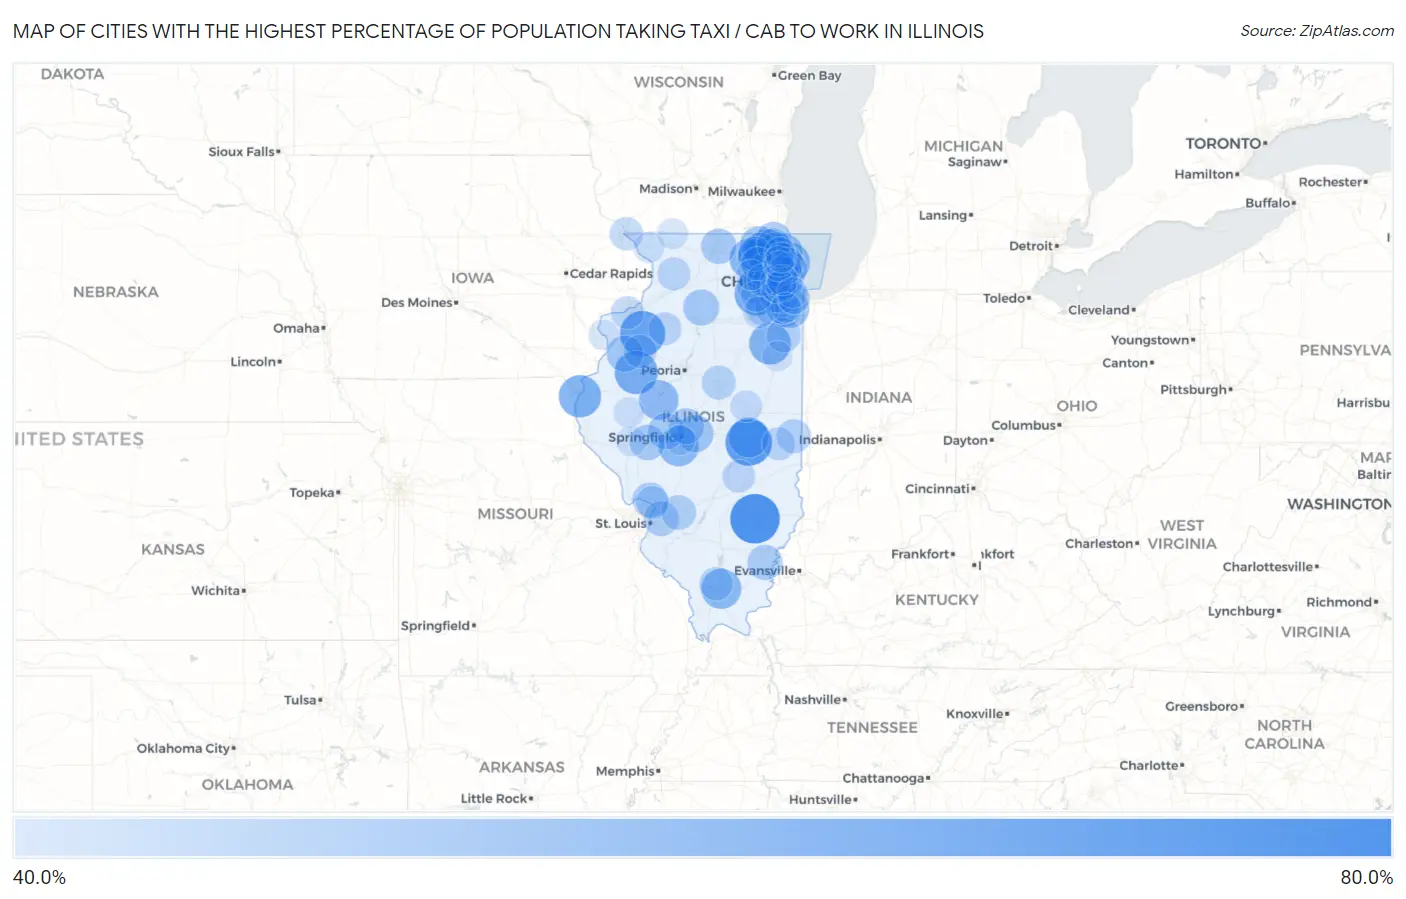
Map of Cities with the Highest Percentage of Population Taking Taxi / Cab to Work in Illinois
0.0%
80.0%
Cities with the Highest Percentage of Population Taking Taxi / Cab to Work in Illinois
| City | % Take Taxi / Cab | vs State | vs National | |
| 1. | Clay City | 73.7% | 37.8%(+35.9)#1 | 38.2%(+35.5)#12 |
| 2. | Arthur | 69.8% | 37.8%(+32.0)#2 | 38.2%(+31.6)#38 |
| 3. | Woodhull | 68.2% | 37.8%(+30.4)#3 | 38.2%(+30.0)#60 |
| 4. | Boulder Hill | 65.5% | 37.8%(+27.7)#4 | 38.2%(+27.3)#104 |
| 5. | Avon | 65.3% | 37.8%(+27.5)#5 | 38.2%(+27.1)#112 |
| 6. | Warsaw | 64.1% | 37.8%(+26.3)#6 | 38.2%(+25.9)#151 |
| 7. | Elk Grove Village | 64.0% | 37.8%(+26.2)#7 | 38.2%(+25.8)#154 |
| 8. | Lake Zurich | 63.4% | 37.8%(+25.6)#8 | 38.2%(+25.2)#172 |
| 9. | Herscher | 63.2% | 37.8%(+25.4)#9 | 38.2%(+25.0)#186 |
| 10. | Wauconda | 63.1% | 37.8%(+25.3)#10 | 38.2%(+24.9)#190 |
| 11. | Huntley | 62.0% | 37.8%(+24.2)#11 | 38.2%(+23.8)#240 |
| 12. | Marion | 61.3% | 37.8%(+23.5)#12 | 38.2%(+23.1)#276 |
| 13. | Atwood | 61.3% | 37.8%(+23.5)#13 | 38.2%(+23.1)#283 |
| 14. | Chatham | 61.2% | 37.8%(+23.4)#14 | 38.2%(+23.0)#285 |
| 15. | Winnetka | 61.2% | 37.8%(+23.4)#15 | 38.2%(+23.0)#287 |
| 16. | Havana | 60.6% | 37.8%(+22.8)#16 | 38.2%(+22.4)#316 |
| 17. | Hillside | 60.3% | 37.8%(+22.5)#17 | 38.2%(+22.1)#336 |
| 18. | Matteson | 59.2% | 37.8%(+21.4)#18 | 38.2%(+21.0)#424 |
| 19. | Itasca | 59.2% | 37.8%(+21.4)#19 | 38.2%(+21.0)#427 |
| 20. | Lake Forest | 58.4% | 37.8%(+20.6)#20 | 38.2%(+20.2)#477 |
| 21. | Winfield | 58.4% | 37.8%(+20.6)#21 | 38.2%(+20.2)#480 |
| 22. | Algonquin | 58.3% | 37.8%(+20.5)#22 | 38.2%(+20.1)#491 |
| 23. | Elmwood Park | 58.3% | 37.8%(+20.5)#23 | 38.2%(+20.1)#493 |
| 24. | Glen Ellyn | 58.0% | 37.8%(+20.2)#24 | 38.2%(+19.8)#532 |
| 25. | Mchenry | 57.8% | 37.8%(+20.0)#25 | 38.2%(+19.6)#545 |
| 26. | Buffalo | 57.5% | 37.8%(+19.7)#26 | 38.2%(+19.3)#586 |
| 27. | Monmouth | 56.3% | 37.8%(+18.5)#27 | 38.2%(+18.1)#693 |
| 28. | Pleasant Plains | 56.2% | 37.8%(+18.4)#28 | 38.2%(+18.0)#711 |
| 29. | Lindenhurst | 56.1% | 37.8%(+18.3)#29 | 38.2%(+17.9)#716 |
| 30. | La Moille | 56.1% | 37.8%(+18.3)#30 | 38.2%(+17.9)#722 |
| 31. | Northbrook | 55.9% | 37.8%(+18.1)#31 | 38.2%(+17.7)#734 |
| 32. | Williamsville | 55.7% | 37.8%(+17.9)#32 | 38.2%(+17.5)#759 |
| 33. | Jacksonville | 55.5% | 37.8%(+17.7)#33 | 38.2%(+17.3)#775 |
| 34. | Libertyville | 55.4% | 37.8%(+17.6)#34 | 38.2%(+17.2)#792 |
| 35. | Loves Park | 55.1% | 37.8%(+17.3)#35 | 38.2%(+16.9)#836 |
| 36. | North Aurora | 55.1% | 37.8%(+17.3)#36 | 38.2%(+16.9)#838 |
| 37. | Carmi | 54.9% | 37.8%(+17.1)#37 | 38.2%(+16.7)#866 |
| 38. | Godfrey | 54.6% | 37.8%(+16.8)#38 | 38.2%(+16.4)#883 |
| 39. | Collinsville | 54.5% | 37.8%(+16.7)#39 | 38.2%(+16.3)#893 |
| 40. | Lake In The Hills | 54.4% | 37.8%(+16.6)#40 | 38.2%(+16.2)#901 |
| 41. | Norridge | 54.4% | 37.8%(+16.6)#41 | 38.2%(+16.2)#905 |
| 42. | Prairie Grove | 54.4% | 37.8%(+16.6)#42 | 38.2%(+16.2)#913 |
| 43. | Downers Grove | 54.2% | 37.8%(+16.4)#43 | 38.2%(+16.0)#936 |
| 44. | Highland | 54.2% | 37.8%(+16.4)#44 | 38.2%(+16.0)#939 |
| 45. | Skokie | 54.1% | 37.8%(+16.3)#45 | 38.2%(+15.9)#949 |
| 46. | Streamwood | 54.1% | 37.8%(+16.3)#46 | 38.2%(+15.9)#950 |
| 47. | Westchester | 53.9% | 37.8%(+16.1)#47 | 38.2%(+15.7)#981 |
| 48. | Frankfort | 53.8% | 37.8%(+16.0)#48 | 38.2%(+15.6)#988 |
| 49. | Ingalls Park | 53.8% | 37.8%(+16.0)#49 | 38.2%(+15.6)#992 |
| 50. | Crystal Lake | 53.7% | 37.8%(+15.9)#50 | 38.2%(+15.5)#998 |
| 51. | Bradley | 53.7% | 37.8%(+15.9)#51 | 38.2%(+15.5)#999 |
| 52. | Chrisman | 53.5% | 37.8%(+15.7)#52 | 38.2%(+15.3)#1,017 |
| 53. | Palos Park | 53.4% | 37.8%(+15.6)#53 | 38.2%(+15.2)#1,030 |
| 54. | Normal | 53.3% | 37.8%(+15.5)#54 | 38.2%(+15.1)#1,033 |
| 55. | Grayslake | 53.2% | 37.8%(+15.4)#55 | 38.2%(+15.0)#1,049 |
| 56. | Riverside | 53.1% | 37.8%(+15.3)#56 | 38.2%(+14.9)#1,061 |
| 57. | Wheaton | 52.8% | 37.8%(+15.0)#57 | 38.2%(+14.6)#1,089 |
| 58. | Herrin | 52.8% | 37.8%(+15.0)#58 | 38.2%(+14.6)#1,094 |
| 59. | Sleepy Hollow | 52.5% | 37.8%(+14.7)#59 | 38.2%(+14.3)#1,124 |
| 60. | East Dubuque | 52.4% | 37.8%(+14.6)#60 | 38.2%(+14.2)#1,142 |
| 61. | Galesburg | 52.3% | 37.8%(+14.5)#61 | 38.2%(+14.1)#1,151 |
| 62. | Shorewood | 52.3% | 37.8%(+14.5)#62 | 38.2%(+14.1)#1,158 |
| 63. | Brocton | 52.3% | 37.8%(+14.5)#63 | 38.2%(+14.1)#1,169 |
| 64. | Alton | 52.2% | 37.8%(+14.4)#64 | 38.2%(+14.0)#1,170 |
| 65. | Hinsdale | 52.1% | 37.8%(+14.3)#65 | 38.2%(+13.9)#1,183 |
| 66. | Kewanee | 52.1% | 37.8%(+14.3)#66 | 38.2%(+13.9)#1,185 |
| 67. | Milledgeville | 52.1% | 37.8%(+14.3)#67 | 38.2%(+13.9)#1,190 |
| 68. | Rock Island | 52.0% | 37.8%(+14.2)#68 | 38.2%(+13.8)#1,194 |
| 69. | Mokena | 52.0% | 37.8%(+14.2)#69 | 38.2%(+13.8)#1,197 |
| 70. | La Grange Park | 51.9% | 37.8%(+14.1)#70 | 38.2%(+13.7)#1,210 |
| 71. | Broadview | 51.8% | 37.8%(+14.0)#71 | 38.2%(+13.6)#1,221 |
| 72. | Stewardson | 51.8% | 37.8%(+14.0)#72 | 38.2%(+13.6)#1,223 |
| 73. | Northfield | 51.6% | 37.8%(+13.8)#73 | 38.2%(+13.4)#1,247 |
| 74. | Lemont | 51.4% | 37.8%(+13.6)#74 | 38.2%(+13.2)#1,284 |
| 75. | Rosemont | 51.4% | 37.8%(+13.6)#75 | 38.2%(+13.2)#1,293 |
| 76. | Blue Island | 51.2% | 37.8%(+13.4)#76 | 38.2%(+13.0)#1,322 |
| 77. | Mansfield | 50.5% | 37.8%(+12.7)#77 | 38.2%(+12.3)#1,407 |
| 78. | Minooka | 50.4% | 37.8%(+12.6)#78 | 38.2%(+12.2)#1,418 |
| 79. | West Chicago | 50.1% | 37.8%(+12.3)#79 | 38.2%(+11.9)#1,466 |
| 80. | Dixmoor | 50.0% | 37.8%(+12.2)#80 | 38.2%(+11.8)#1,479 |
| 81. | Oswego | 49.7% | 37.8%(+11.9)#81 | 38.2%(+11.5)#1,509 |
| 82. | Morton Grove | 49.5% | 37.8%(+11.7)#82 | 38.2%(+11.3)#1,541 |
| 83. | Westmont | 49.4% | 37.8%(+11.6)#83 | 38.2%(+11.2)#1,565 |
| 84. | Villa Park | 49.4% | 37.8%(+11.6)#84 | 38.2%(+11.2)#1,566 |
| 85. | Western Springs | 49.4% | 37.8%(+11.6)#85 | 38.2%(+11.2)#1,571 |
| 86. | Elizabeth | 49.3% | 37.8%(+11.5)#86 | 38.2%(+11.1)#1,605 |
| 87. | Mettawa | 49.3% | 37.8%(+11.5)#87 | 38.2%(+11.1)#1,608 |
| 88. | Winslow | 49.3% | 37.8%(+11.5)#88 | 38.2%(+11.1)#1,610 |
| 89. | Rushville | 49.1% | 37.8%(+11.3)#89 | 38.2%(+10.9)#1,637 |
| 90. | Evergreen Park | 49.0% | 37.8%(+11.2)#90 | 38.2%(+10.8)#1,647 |
| 91. | Bellwood | 49.0% | 37.8%(+11.2)#91 | 38.2%(+10.8)#1,648 |
| 92. | Campton Hills | 48.9% | 37.8%(+11.1)#92 | 38.2%(+10.7)#1,669 |
| 93. | Wheeling | 48.8% | 37.8%(+11.0)#93 | 38.2%(+10.6)#1,676 |
| 94. | New Boston | 48.8% | 37.8%(+11.0)#94 | 38.2%(+10.6)#1,697 |
| 95. | Mount Prospect | 48.6% | 37.8%(+10.8)#95 | 38.2%(+10.4)#1,722 |
| 96. | Springfield | 48.5% | 37.8%(+10.7)#96 | 38.2%(+10.3)#1,734 |
| 97. | Frankfort Square | 48.5% | 37.8%(+10.7)#97 | 38.2%(+10.3)#1,750 |
| 98. | Riverwoods | 48.5% | 37.8%(+10.7)#98 | 38.2%(+10.3)#1,754 |
| 99. | Ashkum | 48.5% | 37.8%(+10.7)#99 | 38.2%(+10.3)#1,759 |
| 100. | Bluffs | 48.5% | 37.8%(+10.7)#100 | 38.2%(+10.3)#1,760 |
Common Questions
What are the Top 10 Cities with the Highest Percentage of Population Taking Taxi / Cab to Work in Illinois?
Top 10 Cities with the Highest Percentage of Population Taking Taxi / Cab to Work in Illinois are:
#1
73.7%
#2
69.8%
#3
68.2%
#4
65.5%
#5
65.3%
#6
64.1%
#7
64.0%
#8
63.4%
#9
63.2%
#10
63.1%
What city has the Highest Percentage of Population Taking Taxi / Cab to Work in Illinois?
Clay City has the Highest Percentage of Population Taking Taxi / Cab to Work in Illinois with 73.7%.
What is the Percentage of Population Taking Taxi / Cab to Work in the State of Illinois?
Percentage of Population Taking Taxi / Cab to Work in Illinois is 37.8%.
What is the Percentage of Population Taking Taxi / Cab to Work in the United States?
Percentage of Population Taking Taxi / Cab to Work in the United States is 38.2%.