Zip Codes with the Highest Percentage of Population Taking Taxi / Cab to Work in Trenton, NJ
RELATED REPORTS & OPTIONS
Taxi / Cab
Trenton
Compare Zip Codes
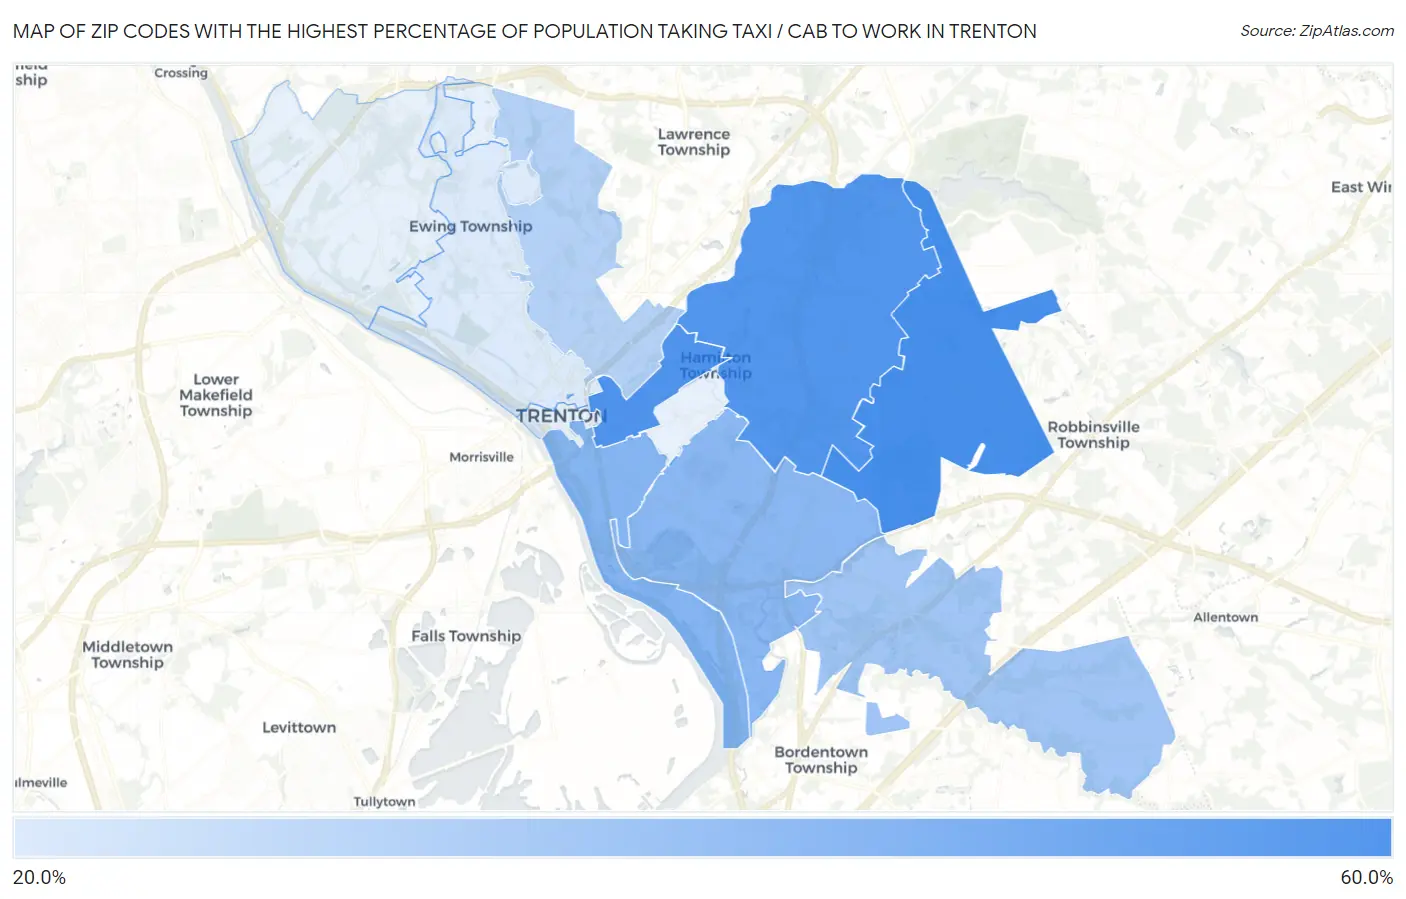
Map of Zip Codes with the Highest Percentage of Population Taking Taxi / Cab to Work in Trenton
22.0%
57.1%
Zip Codes with the Highest Percentage of Population Taking Taxi / Cab to Work in Trenton, NJ
| Zip Code | % Take Taxi / Cab | vs State | vs National | |
| 1. | 08690 | 57.1% | 39.4%(+17.7)#30 | 38.2%(+18.9)#1,159 |
| 2. | 08609 | 55.0% | 39.4%(+15.6)#45 | 38.2%(+16.8)#1,609 |
| 3. | 08619 | 53.9% | 39.4%(+14.5)#56 | 38.2%(+15.7)#1,868 |
| 4. | 08611 | 41.3% | 39.4%(+1.90)#185 | 38.2%(+3.10)#6,031 |
| 5. | 08610 | 40.1% | 39.4%(+0.700)#203 | 38.2%(+1.90)#6,569 |
| 6. | 08620 | 34.9% | 39.4%(-4.50)#280 | 38.2%(-3.30)#8,939 |
| 7. | 08638 | 31.0% | 39.4%(-8.40)#317 | 38.2%(-7.20)#10,527 |
| 8. | 08618 | 22.0% | 39.4%(-17.4)#351 | 38.2%(-16.2)#12,754 |
1
Common Questions
What are the Top 10 Zip Codes with the Highest Percentage of Population Taking Taxi / Cab to Work in Trenton, NJ?
Top 10 Zip Codes with the Highest Percentage of Population Taking Taxi / Cab to Work in Trenton, NJ are:
What zip code has the Highest Percentage of Population Taking Taxi / Cab to Work in Trenton, NJ?
08690 has the Highest Percentage of Population Taking Taxi / Cab to Work in Trenton, NJ with 57.1%.
What is the Percentage of Population Taking Taxi / Cab to Work in Trenton, NJ?
Percentage of Population Taking Taxi / Cab to Work in Trenton is 38.0%.
What is the Percentage of Population Taking Taxi / Cab to Work in New Jersey?
Percentage of Population Taking Taxi / Cab to Work in New Jersey is 39.4%.
What is the Percentage of Population Taking Taxi / Cab to Work in the United States?
Percentage of Population Taking Taxi / Cab to Work in the United States is 38.2%.