Zip Codes with the Highest Percentage of Population Taking Taxi / Cab to Work in Camden, NJ
RELATED REPORTS & OPTIONS
Taxi / Cab
Camden
Compare Zip Codes
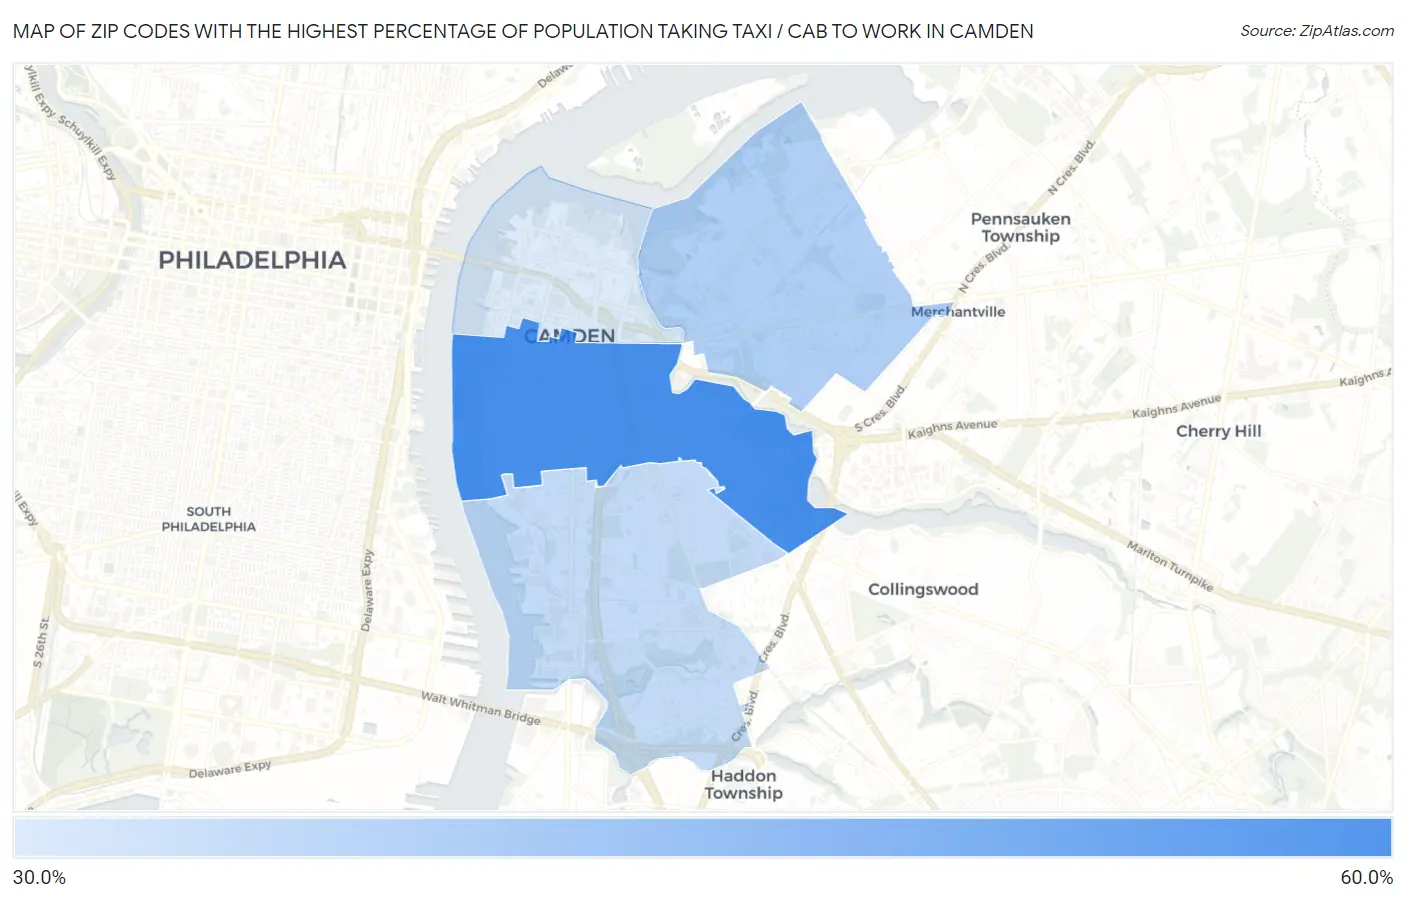
Map of Zip Codes with the Highest Percentage of Population Taking Taxi / Cab to Work in Camden
34.1%
56.5%
Zip Codes with the Highest Percentage of Population Taking Taxi / Cab to Work in Camden, NJ
| Zip Code | % Take Taxi / Cab | vs State | vs National | |
| 1. | 08103 | 56.5% | 39.4%(+17.1)#35 | 38.2%(+18.3)#1,244 |
| 2. | 08105 | 40.3% | 39.4%(+0.900)#200 | 38.2%(+2.10)#6,487 |
| 3. | 08104 | 37.6% | 39.4%(-1.80)#235 | 38.2%(-0.600)#7,683 |
| 4. | 08102 | 34.1% | 39.4%(-5.30)#291 | 38.2%(-4.10)#9,320 |
1
Common Questions
What are the Top 3 Zip Codes with the Highest Percentage of Population Taking Taxi / Cab to Work in Camden, NJ?
Top 3 Zip Codes with the Highest Percentage of Population Taking Taxi / Cab to Work in Camden, NJ are:
What zip code has the Highest Percentage of Population Taking Taxi / Cab to Work in Camden, NJ?
08103 has the Highest Percentage of Population Taking Taxi / Cab to Work in Camden, NJ with 56.5%.
What is the Percentage of Population Taking Taxi / Cab to Work in Camden, NJ?
Percentage of Population Taking Taxi / Cab to Work in Camden is 37.6%.
What is the Percentage of Population Taking Taxi / Cab to Work in New Jersey?
Percentage of Population Taking Taxi / Cab to Work in New Jersey is 39.4%.
What is the Percentage of Population Taking Taxi / Cab to Work in the United States?
Percentage of Population Taking Taxi / Cab to Work in the United States is 38.2%.