Cities with the Highest Percentage of Population Taking Taxi / Cab to Work in South Carolina
RELATED REPORTS & OPTIONS
Taxi / Cab
South Carolina
Compare Cities
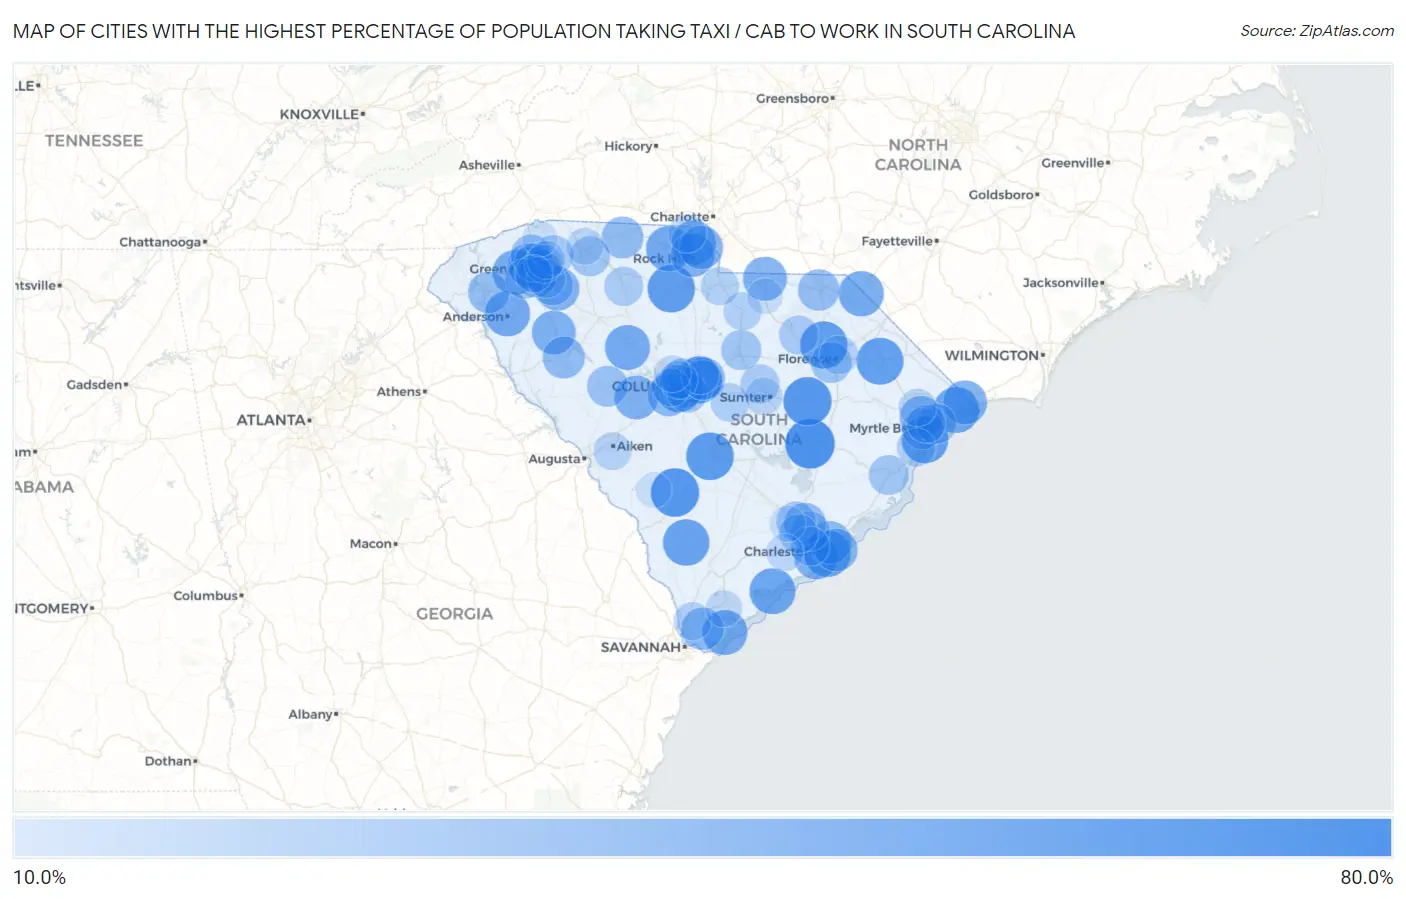
Map of Cities with the Highest Percentage of Population Taking Taxi / Cab to Work in South Carolina
0.0%
80.0%
Cities with the Highest Percentage of Population Taking Taxi / Cab to Work in South Carolina
| City | % Take Taxi / Cab | vs State | vs National | |
| 1. | Greeleyville | 69.3% | 39.1%(+30.2)#1 | 38.2%(+31.1)#47 |
| 2. | Govan | 65.3% | 39.1%(+26.2)#2 | 38.2%(+27.1)#113 |
| 3. | Turbeville | 64.8% | 39.1%(+25.7)#3 | 38.2%(+26.6)#121 |
| 4. | Orangeburg | 62.4% | 39.1%(+23.3)#4 | 38.2%(+24.2)#214 |
| 5. | Chester | 61.7% | 39.1%(+22.6)#5 | 38.2%(+23.5)#256 |
| 6. | Darlington | 61.3% | 39.1%(+22.2)#6 | 38.2%(+23.1)#278 |
| 7. | Marion | 60.4% | 39.1%(+21.3)#7 | 38.2%(+22.2)#324 |
| 8. | Forest Acres | 59.8% | 39.1%(+20.7)#8 | 38.2%(+21.6)#372 |
| 9. | Oak Grove | 59.6% | 39.1%(+20.5)#9 | 38.2%(+21.4)#384 |
| 10. | Surfside Beach | 59.0% | 39.1%(+19.9)#10 | 38.2%(+20.8)#450 |
| 11. | Varnville | 58.3% | 39.1%(+19.2)#11 | 38.2%(+20.1)#501 |
| 12. | Sullivan S Island | 58.0% | 39.1%(+18.9)#12 | 38.2%(+19.8)#537 |
| 13. | North Myrtle Beach | 56.9% | 39.1%(+17.8)#13 | 38.2%(+18.7)#630 |
| 14. | Edisto Beach | 56.5% | 39.1%(+17.4)#14 | 38.2%(+18.3)#665 |
| 15. | Anderson | 54.1% | 39.1%(+15.0)#15 | 38.2%(+15.9)#954 |
| 16. | York | 54.0% | 39.1%(+14.9)#16 | 38.2%(+15.8)#974 |
| 17. | Mccoll | 53.8% | 39.1%(+14.7)#17 | 38.2%(+15.6)#994 |
| 18. | Newberry | 53.2% | 39.1%(+14.1)#18 | 38.2%(+15.0)#1,051 |
| 19. | Hilton Head Island | 52.9% | 39.1%(+13.8)#19 | 38.2%(+14.7)#1,083 |
| 20. | Easley | 52.8% | 39.1%(+13.7)#20 | 38.2%(+14.6)#1,092 |
| 21. | Tega Cay | 50.4% | 39.1%(+11.3)#21 | 38.2%(+12.2)#1,417 |
| 22. | Little River | 49.7% | 39.1%(+10.6)#22 | 38.2%(+11.5)#1,517 |
| 23. | Pageland | 49.4% | 39.1%(+10.3)#23 | 38.2%(+11.2)#1,576 |
| 24. | James Island | 49.1% | 39.1%(+10.00)#24 | 38.2%(+10.9)#1,632 |
| 25. | Batesburg Leesville | 49.1% | 39.1%(+10.00)#25 | 38.2%(+10.9)#1,636 |
| 26. | Rock Hill | 48.9% | 39.1%(+9.80)#26 | 38.2%(+10.7)#1,662 |
| 27. | Ware Shoals | 48.9% | 39.1%(+9.80)#27 | 38.2%(+10.7)#1,674 |
| 28. | Fountain Inn | 48.4% | 39.1%(+9.30)#28 | 38.2%(+10.2)#1,774 |
| 29. | Fort Mill | 47.7% | 39.1%(+8.60)#29 | 38.2%(+9.50)#1,883 |
| 30. | Daufuskie Island | 46.3% | 39.1%(+7.20)#30 | 38.2%(+8.10)#2,149 |
| 31. | Red Hill | 46.2% | 39.1%(+7.10)#31 | 38.2%(+8.00)#2,159 |
| 32. | Berea | 45.6% | 39.1%(+6.50)#32 | 38.2%(+7.40)#2,219 |
| 33. | Mount Pleasant | 45.2% | 39.1%(+6.10)#33 | 38.2%(+7.00)#2,298 |
| 34. | Isle Of Palms | 44.8% | 39.1%(+5.70)#34 | 38.2%(+6.60)#2,356 |
| 35. | Red Bank | 44.6% | 39.1%(+5.50)#35 | 38.2%(+6.40)#2,377 |
| 36. | Woodfield | 44.4% | 39.1%(+5.30)#36 | 38.2%(+6.20)#2,426 |
| 37. | Greenville | 43.6% | 39.1%(+4.50)#37 | 38.2%(+5.40)#2,560 |
| 38. | Bluffton | 43.4% | 39.1%(+4.30)#38 | 38.2%(+5.20)#2,616 |
| 39. | Greenwood | 42.7% | 39.1%(+3.60)#39 | 38.2%(+4.50)#2,738 |
| 40. | Goose Creek | 41.6% | 39.1%(+2.50)#40 | 38.2%(+3.40)#2,958 |
| 41. | Gaffney | 41.4% | 39.1%(+2.30)#41 | 38.2%(+3.20)#3,019 |
| 42. | Cheraw | 40.6% | 39.1%(+1.50)#42 | 38.2%(+2.40)#3,191 |
| 43. | Clemson | 40.2% | 39.1%(+1.10)#43 | 38.2%(+2.00)#3,286 |
| 44. | Parker | 40.0% | 39.1%(+0.900)#44 | 38.2%(+1.80)#3,345 |
| 45. | West Columbia | 39.8% | 39.1%(+0.700)#45 | 38.2%(+1.60)#3,382 |
| 46. | Socastee | 38.9% | 39.1%(-0.200)#46 | 38.2%(+0.700)#3,579 |
| 47. | St Andrews | 38.6% | 39.1%(-0.500)#47 | 38.2%(+0.400)#3,658 |
| 48. | Saluda | 38.6% | 39.1%(-0.500)#48 | 38.2%(+0.400)#3,666 |
| 49. | Simpsonville | 38.5% | 39.1%(-0.600)#49 | 38.2%(+0.300)#3,680 |
| 50. | Travelers Rest | 38.1% | 39.1%(-1.00)#50 | 38.2%(-0.100)#3,782 |
| 51. | Florence | 37.8% | 39.1%(-1.30)#51 | 38.2%(-0.400)#3,846 |
| 52. | Myrtle Beach | 36.3% | 39.1%(-2.80)#52 | 38.2%(-1.90)#4,212 |
| 53. | Cayce | 35.6% | 39.1%(-3.50)#53 | 38.2%(-2.60)#4,391 |
| 54. | Camden | 35.5% | 39.1%(-3.60)#54 | 38.2%(-2.70)#4,421 |
| 55. | Spartanburg | 35.4% | 39.1%(-3.70)#55 | 38.2%(-2.80)#4,432 |
| 56. | Gantt | 35.2% | 39.1%(-3.90)#56 | 38.2%(-3.00)#4,485 |
| 57. | Powdersville | 34.8% | 39.1%(-4.30)#57 | 38.2%(-3.40)#4,564 |
| 58. | Georgetown | 34.8% | 39.1%(-4.30)#58 | 38.2%(-3.40)#4,565 |
| 59. | Greer | 34.6% | 39.1%(-4.50)#59 | 38.2%(-3.60)#4,599 |
| 60. | Columbia | 34.5% | 39.1%(-4.60)#60 | 38.2%(-3.70)#4,620 |
| 61. | Hanahan | 33.8% | 39.1%(-5.30)#61 | 38.2%(-4.40)#4,769 |
| 62. | Ladson | 33.6% | 39.1%(-5.50)#62 | 38.2%(-4.60)#4,820 |
| 63. | Hartsville | 32.6% | 39.1%(-6.50)#63 | 38.2%(-5.60)#5,012 |
| 64. | Charleston | 31.9% | 39.1%(-7.20)#64 | 38.2%(-6.30)#5,125 |
| 65. | Union | 31.9% | 39.1%(-7.20)#65 | 38.2%(-6.30)#5,144 |
| 66. | North Charleston | 31.8% | 39.1%(-7.30)#66 | 38.2%(-6.40)#5,153 |
| 67. | Dalzell | 31.4% | 39.1%(-7.70)#67 | 38.2%(-6.80)#5,250 |
| 68. | Carolina Forest | 30.9% | 39.1%(-8.20)#68 | 38.2%(-7.30)#5,322 |
| 69. | Sans Souci | 30.5% | 39.1%(-8.60)#69 | 38.2%(-7.70)#5,421 |
| 70. | Dentsville | 29.9% | 39.1%(-9.20)#70 | 38.2%(-8.30)#5,507 |
| 71. | Eastover | 29.9% | 39.1%(-9.20)#71 | 38.2%(-8.30)#5,516 |
| 72. | Mauldin | 29.8% | 39.1%(-9.30)#72 | 38.2%(-8.40)#5,523 |
| 73. | Murrells Inlet | 29.6% | 39.1%(-9.50)#73 | 38.2%(-8.60)#5,572 |
| 74. | Forestbrook | 29.6% | 39.1%(-9.50)#74 | 38.2%(-8.60)#5,576 |
| 75. | Quinby | 29.5% | 39.1%(-9.60)#75 | 38.2%(-8.70)#5,607 |
| 76. | Kershaw | 29.2% | 39.1%(-9.90)#76 | 38.2%(-9.00)#5,664 |
| 77. | Wade Hampton | 29.0% | 39.1%(-10.1)#77 | 38.2%(-9.20)#5,673 |
| 78. | Lancaster | 28.6% | 39.1%(-10.5)#78 | 38.2%(-9.60)#5,749 |
| 79. | Lexington | 28.5% | 39.1%(-10.6)#79 | 38.2%(-9.70)#5,763 |
| 80. | Lake Wylie | 28.5% | 39.1%(-10.6)#80 | 38.2%(-9.70)#5,766 |
| 81. | Hardeeville | 27.9% | 39.1%(-11.2)#81 | 38.2%(-10.3)#5,822 |
| 82. | Aiken | 27.7% | 39.1%(-11.4)#82 | 38.2%(-10.5)#5,848 |
| 83. | Taylors | 27.5% | 39.1%(-11.6)#83 | 38.2%(-10.7)#5,884 |
| 84. | Seven Oaks | 27.4% | 39.1%(-11.7)#84 | 38.2%(-10.8)#5,899 |
| 85. | Conway | 26.7% | 39.1%(-12.4)#85 | 38.2%(-11.5)#5,987 |
| 86. | Sumter | 25.9% | 39.1%(-13.2)#86 | 38.2%(-12.3)#6,069 |
| 87. | Dunean | 25.9% | 39.1%(-13.2)#87 | 38.2%(-12.3)#6,076 |
| 88. | Valley Falls | 25.4% | 39.1%(-13.7)#88 | 38.2%(-12.8)#6,145 |
| 89. | Ravenel | 25.0% | 39.1%(-14.1)#89 | 38.2%(-13.2)#6,180 |
| 90. | Irmo | 24.1% | 39.1%(-15.0)#90 | 38.2%(-14.1)#6,298 |
| 91. | Port Royal | 23.8% | 39.1%(-15.3)#91 | 38.2%(-14.4)#6,326 |
| 92. | Summerville | 21.6% | 39.1%(-17.5)#92 | 38.2%(-16.6)#6,532 |
| 93. | Jefferson | 20.6% | 39.1%(-18.5)#93 | 38.2%(-17.6)#6,616 |
| 94. | Barnwell | 20.3% | 39.1%(-18.8)#94 | 38.2%(-17.9)#6,639 |
| 95. | Clemson University | 19.5% | 39.1%(-19.6)#95 | 38.2%(-18.7)#6,710 |
| 96. | Tigerville | 19.2% | 39.1%(-19.9)#96 | 38.2%(-19.0)#6,720 |
Common Questions
What are the Top 10 Cities with the Highest Percentage of Population Taking Taxi / Cab to Work in South Carolina?
Top 10 Cities with the Highest Percentage of Population Taking Taxi / Cab to Work in South Carolina are:
#1
69.3%
#2
65.3%
#3
64.8%
#4
62.4%
#5
61.7%
#6
61.3%
#7
60.4%
#8
59.8%
#9
59.6%
#10
59.0%
What city has the Highest Percentage of Population Taking Taxi / Cab to Work in South Carolina?
Greeleyville has the Highest Percentage of Population Taking Taxi / Cab to Work in South Carolina with 69.3%.
What is the Percentage of Population Taking Taxi / Cab to Work in the State of South Carolina?
Percentage of Population Taking Taxi / Cab to Work in South Carolina is 39.1%.
What is the Percentage of Population Taking Taxi / Cab to Work in the United States?
Percentage of Population Taking Taxi / Cab to Work in the United States is 38.2%.