Zip Codes with the Highest Percentage of Mexican Population in Paterson, NJ
RELATED REPORTS & OPTIONS
Mexican
Paterson
Compare Zip Codes
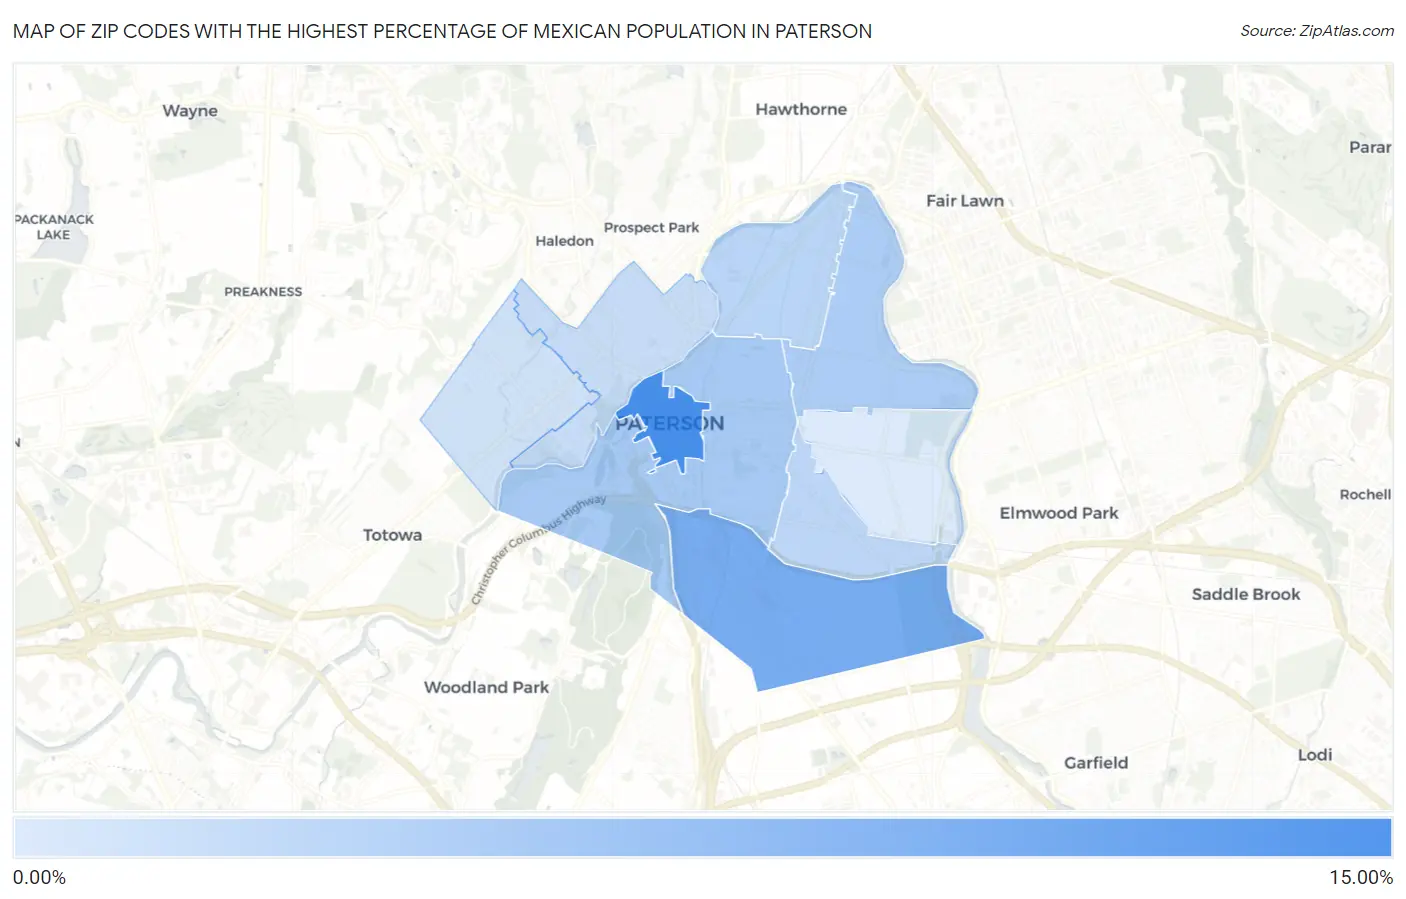
Map of Zip Codes with the Highest Percentage of Mexican Population in Paterson
1.28%
14.48%
Zip Codes with the Highest Percentage of Mexican Population in Paterson, NJ
| Zip Code | Mexican | vs State | vs National | |
| 1. | 07505 | 14.48% | 2.44%(+12.0)#6 | 11.22%(+3.26)#3,875 |
| 2. | 07503 | 9.95% | 2.44%(+7.51)#14 | 11.22%(-1.27)#5,303 |
| 3. | 07501 | 5.77% | 2.44%(+3.33)#37 | 11.22%(-5.45)#7,775 |
| 4. | 07514 | 5.28% | 2.44%(+2.84)#44 | 11.22%(-5.94)#8,226 |
| 5. | 07524 | 4.14% | 2.44%(+1.70)#64 | 11.22%(-7.08)#9,552 |
| 6. | 07513 | 3.93% | 2.44%(+1.49)#69 | 11.22%(-7.29)#9,876 |
| 7. | 07522 | 3.02% | 2.44%(+0.575)#93 | 11.22%(-8.20)#11,497 |
| 8. | 07502 | 2.29% | 2.44%(-0.156)#138 | 11.22%(-8.93)#13,297 |
| 9. | 07504 | 1.28% | 2.44%(-1.16)#219 | 11.22%(-9.94)#16,844 |
1
Common Questions
What are the Top 5 Zip Codes with the Highest Percentage of Mexican Population in Paterson, NJ?
Top 5 Zip Codes with the Highest Percentage of Mexican Population in Paterson, NJ are:
What zip code has the Highest Percentage of Mexican Population in Paterson, NJ?
07505 has the Highest Percentage of Mexican Population in Paterson, NJ with 14.48%.
What is the Percentage of Mexican Population in Paterson, NJ?
Percentage of Mexican Population in Paterson is 5.04%.
What is the Percentage of Mexican Population in New Jersey?
Percentage of Mexican Population in New Jersey is 2.44%.
What is the Percentage of Mexican Population in the United States?
Percentage of Mexican Population in the United States is 11.22%.