Cities with the Highest Percentage of Immigrants from Northern Europe in Oregon
RELATED REPORTS & OPTIONS
Northern Europe
Oregon
Compare Cities
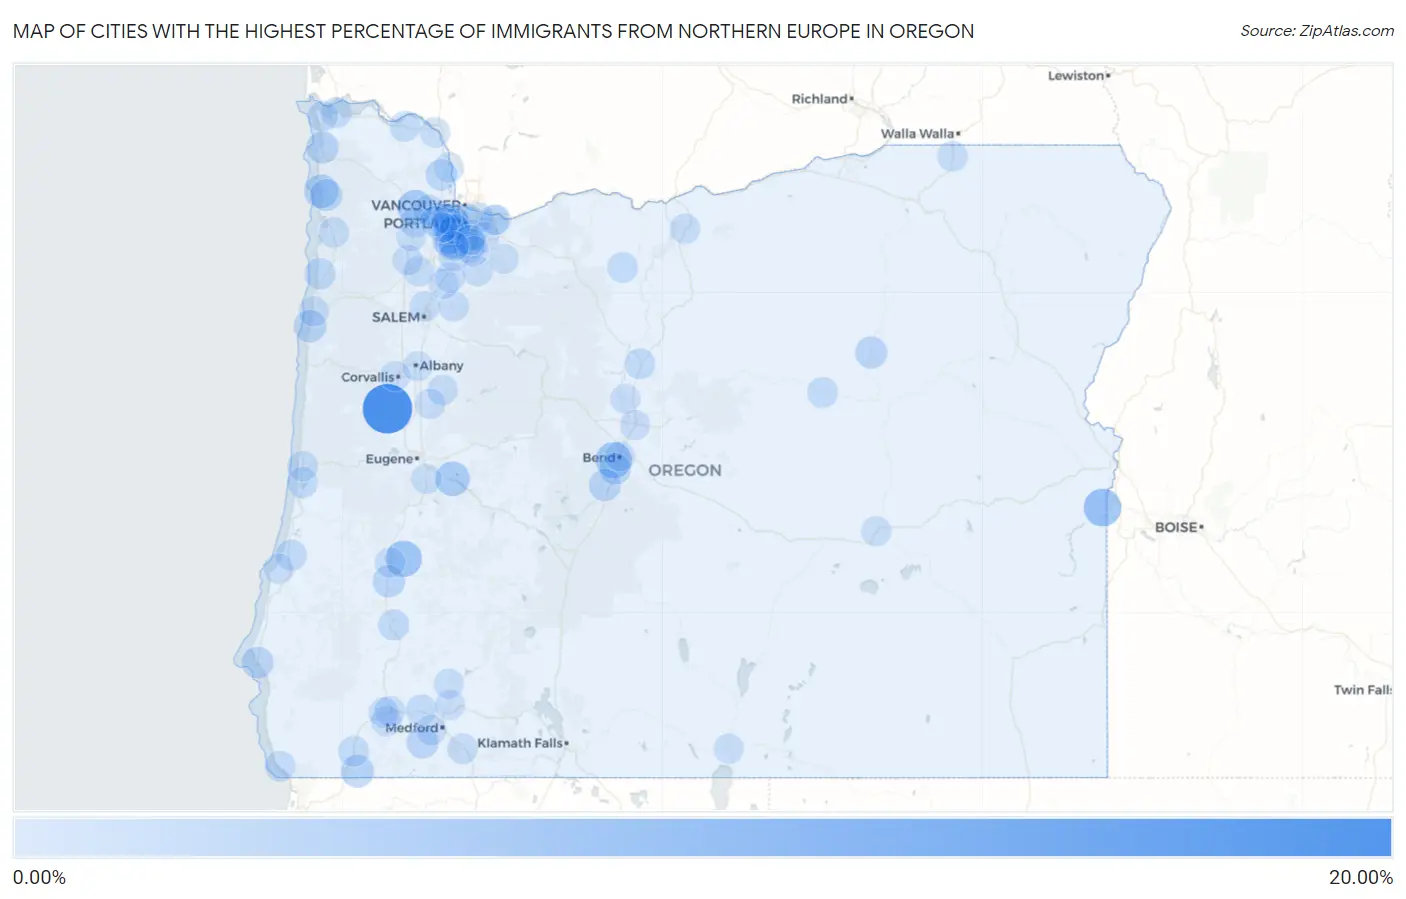
Map of Cities with the Highest Percentage of Immigrants from Northern Europe in Oregon
0.00%
20.00%
Cities with the Highest Percentage of Immigrants from Northern Europe in Oregon
| City | Northern Europe | vs State | vs National | |
| 1. | Bellfountain | 18.60% | 0.38%(+18.2)#1 | 0.29%(+18.3)#10 |
| 2. | Adrian | 7.07% | 0.38%(+6.69)#2 | 0.29%(+6.79)#50 |
| 3. | Fair Oaks | 5.88% | 0.38%(+5.50)#3 | 0.29%(+5.60)#71 |
| 4. | Tetherow | 5.73% | 0.38%(+5.34)#4 | 0.29%(+5.44)#73 |
| 5. | Bly | 5.56% | 0.38%(+5.17)#5 | 0.29%(+5.27)#78 |
| 6. | Banks | 4.79% | 0.38%(+4.41)#6 | 0.29%(+4.50)#99 |
| 7. | Lowell | 4.29% | 0.38%(+3.91)#7 | 0.29%(+4.01)#138 |
| 8. | Cedar Mill | 3.71% | 0.38%(+3.33)#8 | 0.29%(+3.42)#190 |
| 9. | Manzanita | 3.53% | 0.38%(+3.15)#9 | 0.29%(+3.25)#212 |
| 10. | Takilma | 2.84% | 0.38%(+2.46)#10 | 0.29%(+2.56)#302 |
| 11. | Svensen | 2.83% | 0.38%(+2.45)#11 | 0.29%(+2.55)#304 |
| 12. | River Point | 2.56% | 0.38%(+2.18)#12 | 0.29%(+2.28)#377 |
| 13. | Lincoln Beach | 2.41% | 0.38%(+2.03)#13 | 0.29%(+2.13)#406 |
| 14. | Roseburg North | 2.28% | 0.38%(+1.90)#14 | 0.29%(+1.99)#435 |
| 15. | Seaside | 2.24% | 0.38%(+1.86)#15 | 0.29%(+1.95)#447 |
| 16. | Long Creek | 2.11% | 0.38%(+1.72)#16 | 0.29%(+1.82)#489 |
| 17. | Wheeler | 2.10% | 0.38%(+1.72)#17 | 0.29%(+1.81)#493 |
| 18. | Rockcreek | 2.09% | 0.38%(+1.70)#18 | 0.29%(+1.80)#500 |
| 19. | Cedar Hills | 2.07% | 0.38%(+1.69)#19 | 0.29%(+1.79)#506 |
| 20. | Sunriver | 2.04% | 0.38%(+1.66)#20 | 0.29%(+1.76)#519 |
| 21. | Garden Home Whitford | 1.92% | 0.38%(+1.54)#21 | 0.29%(+1.63)#572 |
| 22. | Ruch | 1.90% | 0.38%(+1.52)#22 | 0.29%(+1.62)#581 |
| 23. | Port Orford | 1.78% | 0.38%(+1.40)#23 | 0.29%(+1.50)#638 |
| 24. | Deschutes River Woods | 1.66% | 0.38%(+1.28)#24 | 0.29%(+1.38)#707 |
| 25. | King City | 1.54% | 0.38%(+1.16)#25 | 0.29%(+1.26)#794 |
| 26. | Warren | 1.43% | 0.38%(+1.05)#26 | 0.29%(+1.14)#884 |
| 27. | Pacific City | 1.36% | 0.38%(+0.976)#27 | 0.29%(+1.07)#948 |
| 28. | Bull Mountain | 1.17% | 0.38%(+0.788)#28 | 0.29%(+0.884)#1,179 |
| 29. | Tri City | 1.13% | 0.38%(+0.746)#29 | 0.29%(+0.843)#1,240 |
| 30. | Glasgow | 1.09% | 0.38%(+0.705)#30 | 0.29%(+0.802)#1,303 |
| 31. | Lake Oswego | 1.05% | 0.38%(+0.668)#31 | 0.29%(+0.765)#1,371 |
| 32. | Gold Hill | 1.03% | 0.38%(+0.649)#32 | 0.29%(+0.746)#1,406 |
| 33. | Madras | 1.00% | 0.38%(+0.619)#33 | 0.29%(+0.715)#1,471 |
| 34. | Heceta Beach | 0.99% | 0.38%(+0.608)#34 | 0.29%(+0.704)#1,495 |
| 35. | Clatskanie | 0.91% | 0.38%(+0.529)#35 | 0.29%(+0.626)#1,657 |
| 36. | Marlene | 0.91% | 0.38%(+0.526)#36 | 0.29%(+0.623)#1,667 |
| 37. | Dunes City | 0.90% | 0.38%(+0.517)#37 | 0.29%(+0.614)#1,689 |
| 38. | West Linn | 0.90% | 0.38%(+0.516)#38 | 0.29%(+0.613)#1,692 |
| 39. | Maywood Park | 0.86% | 0.38%(+0.481)#39 | 0.29%(+0.578)#1,783 |
| 40. | North Plains | 0.86% | 0.38%(+0.480)#40 | 0.29%(+0.576)#1,786 |
| 41. | Durham | 0.86% | 0.38%(+0.478)#41 | 0.29%(+0.575)#1,788 |
| 42. | Brookings | 0.85% | 0.38%(+0.466)#42 | 0.29%(+0.563)#1,820 |
| 43. | Pine Hollow | 0.83% | 0.38%(+0.449)#43 | 0.29%(+0.546)#1,870 |
| 44. | Astoria | 0.81% | 0.38%(+0.423)#44 | 0.29%(+0.520)#1,944 |
| 45. | West Haven Sylvan | 0.79% | 0.38%(+0.406)#45 | 0.29%(+0.503)#1,999 |
| 46. | Cave Junction | 0.79% | 0.38%(+0.403)#46 | 0.29%(+0.500)#2,009 |
| 47. | Dayville | 0.78% | 0.38%(+0.396)#47 | 0.29%(+0.493)#2,027 |
| 48. | Milton Freewater | 0.74% | 0.38%(+0.360)#48 | 0.29%(+0.457)#2,134 |
| 49. | Ashland | 0.72% | 0.38%(+0.337)#49 | 0.29%(+0.434)#2,198 |
| 50. | Warrenton | 0.72% | 0.38%(+0.337)#50 | 0.29%(+0.434)#2,199 |
| 51. | New Hope | 0.71% | 0.38%(+0.333)#51 | 0.29%(+0.429)#2,213 |
| 52. | Keizer | 0.71% | 0.38%(+0.328)#52 | 0.29%(+0.425)#2,225 |
| 53. | Milwaukie | 0.70% | 0.38%(+0.316)#53 | 0.29%(+0.413)#2,260 |
| 54. | Jacksonville | 0.70% | 0.38%(+0.316)#54 | 0.29%(+0.413)#2,261 |
| 55. | Tigard | 0.66% | 0.38%(+0.281)#55 | 0.29%(+0.378)#2,393 |
| 56. | Tillamook | 0.63% | 0.38%(+0.251)#56 | 0.29%(+0.347)#2,500 |
| 57. | Silverton | 0.57% | 0.38%(+0.193)#57 | 0.29%(+0.289)#2,769 |
| 58. | Portland | 0.57% | 0.38%(+0.188)#58 | 0.29%(+0.285)#2,797 |
| 59. | Grants Pass | 0.56% | 0.38%(+0.180)#59 | 0.29%(+0.277)#2,831 |
| 60. | Dayton | 0.56% | 0.38%(+0.178)#60 | 0.29%(+0.275)#2,846 |
| 61. | Carlton | 0.56% | 0.38%(+0.174)#61 | 0.29%(+0.270)#2,864 |
| 62. | Sodaville | 0.55% | 0.38%(+0.167)#62 | 0.29%(+0.264)#2,897 |
| 63. | Moro | 0.55% | 0.38%(+0.166)#63 | 0.29%(+0.263)#2,907 |
| 64. | Rainier | 0.55% | 0.38%(+0.165)#64 | 0.29%(+0.262)#2,915 |
| 65. | Happy Valley | 0.54% | 0.38%(+0.155)#65 | 0.29%(+0.252)#2,959 |
| 66. | Florence | 0.53% | 0.38%(+0.151)#66 | 0.29%(+0.247)#2,973 |
| 67. | Beaverton | 0.53% | 0.38%(+0.147)#67 | 0.29%(+0.244)#2,998 |
| 68. | Sutherlin | 0.53% | 0.38%(+0.146)#68 | 0.29%(+0.243)#3,001 |
| 69. | Lincoln City | 0.46% | 0.38%(+0.078)#69 | 0.29%(+0.174)#3,371 |
| 70. | Jennings Lodge | 0.44% | 0.38%(+0.062)#70 | 0.29%(+0.158)#3,484 |
| 71. | Lakeview | 0.44% | 0.38%(+0.059)#71 | 0.29%(+0.156)#3,497 |
| 72. | Woodburn | 0.44% | 0.38%(+0.056)#72 | 0.29%(+0.153)#3,511 |
| 73. | Hubbard | 0.44% | 0.38%(+0.056)#73 | 0.29%(+0.152)#3,515 |
| 74. | Raleigh Hills | 0.43% | 0.38%(+0.048)#74 | 0.29%(+0.145)#3,562 |
| 75. | Creswell | 0.43% | 0.38%(+0.046)#75 | 0.29%(+0.143)#3,582 |
| 76. | Redwood | 0.43% | 0.38%(+0.045)#76 | 0.29%(+0.142)#3,587 |
| 77. | Eagle Point | 0.42% | 0.38%(+0.039)#77 | 0.29%(+0.136)#3,629 |
| 78. | Mulino | 0.41% | 0.38%(+0.026)#78 | 0.29%(+0.123)#3,730 |
| 79. | Crooked River Ranch | 0.40% | 0.38%(+0.021)#79 | 0.29%(+0.118)#3,773 |
| 80. | Wilsonville | 0.40% | 0.38%(+0.014)#80 | 0.29%(+0.111)#3,837 |
| 81. | St Helens | 0.39% | 0.38%(+0.010)#81 | 0.29%(+0.107)#3,861 |
| 82. | Corvallis | 0.39% | 0.38%(+0.009)#82 | 0.29%(+0.106)#3,871 |
| 83. | Brownsville | 0.38% | 0.38%(-0.000)#83 | 0.29%(+0.097)#3,956 |
| 84. | Oregon City | 0.37% | 0.38%(-0.008)#84 | 0.29%(+0.089)#4,022 |
| 85. | Oak Grove | 0.36% | 0.38%(-0.023)#85 | 0.29%(+0.074)#4,138 |
| 86. | Shady Cove | 0.36% | 0.38%(-0.025)#86 | 0.29%(+0.071)#4,164 |
| 87. | Oak Hills | 0.36% | 0.38%(-0.026)#87 | 0.29%(+0.071)#4,165 |
| 88. | Forest Grove | 0.35% | 0.38%(-0.030)#88 | 0.29%(+0.066)#4,209 |
| 89. | Barview | 0.35% | 0.38%(-0.034)#89 | 0.29%(+0.062)#4,248 |
| 90. | Redmond | 0.33% | 0.38%(-0.049)#90 | 0.29%(+0.048)#4,377 |
| 91. | Albany | 0.33% | 0.38%(-0.052)#91 | 0.29%(+0.045)#4,400 |
| 92. | Wood Village | 0.33% | 0.38%(-0.052)#92 | 0.29%(+0.044)#4,406 |
| 93. | Troutdale | 0.33% | 0.38%(-0.054)#93 | 0.29%(+0.043)#4,419 |
| 94. | Tualatin | 0.33% | 0.38%(-0.055)#94 | 0.29%(+0.042)#4,425 |
| 95. | Estacada | 0.32% | 0.38%(-0.057)#95 | 0.29%(+0.039)#4,451 |
| 96. | Gaston | 0.32% | 0.38%(-0.058)#96 | 0.29%(+0.039)#4,454 |
| 97. | Aloha | 0.31% | 0.38%(-0.074)#97 | 0.29%(+0.023)#4,598 |
| 98. | Hillsboro | 0.30% | 0.38%(-0.080)#98 | 0.29%(+0.017)#4,657 |
| 99. | Bend | 0.30% | 0.38%(-0.081)#99 | 0.29%(+0.015)#4,674 |
| 100. | Burns | 0.29% | 0.38%(-0.090)#100 | 0.29%(+0.007)#4,760 |
Common Questions
What are the Top 10 Cities with the Highest Percentage of Immigrants from Northern Europe in Oregon?
Top 10 Cities with the Highest Percentage of Immigrants from Northern Europe in Oregon are:
#1
18.60%
#2
7.07%
#3
5.88%
#4
5.73%
#5
4.79%
#6
4.29%
#7
3.71%
#8
3.53%
#9
2.84%
#10
2.41%
What city has the Highest Percentage of Immigrants from Northern Europe in Oregon?
Bellfountain has the Highest Percentage of Immigrants from Northern Europe in Oregon with 18.60%.
What is the Percentage of Immigrants from Northern Europe in the State of Oregon?
Percentage of Immigrants from Northern Europe in Oregon is 0.38%.
What is the Percentage of Immigrants from Northern Europe in the United States?
Percentage of Immigrants from Northern Europe in the United States is 0.29%.