Cities with the Highest Percentage of Immigrants from Northern Europe in New Mexico
RELATED REPORTS & OPTIONS
Northern Europe
New Mexico
Compare Cities
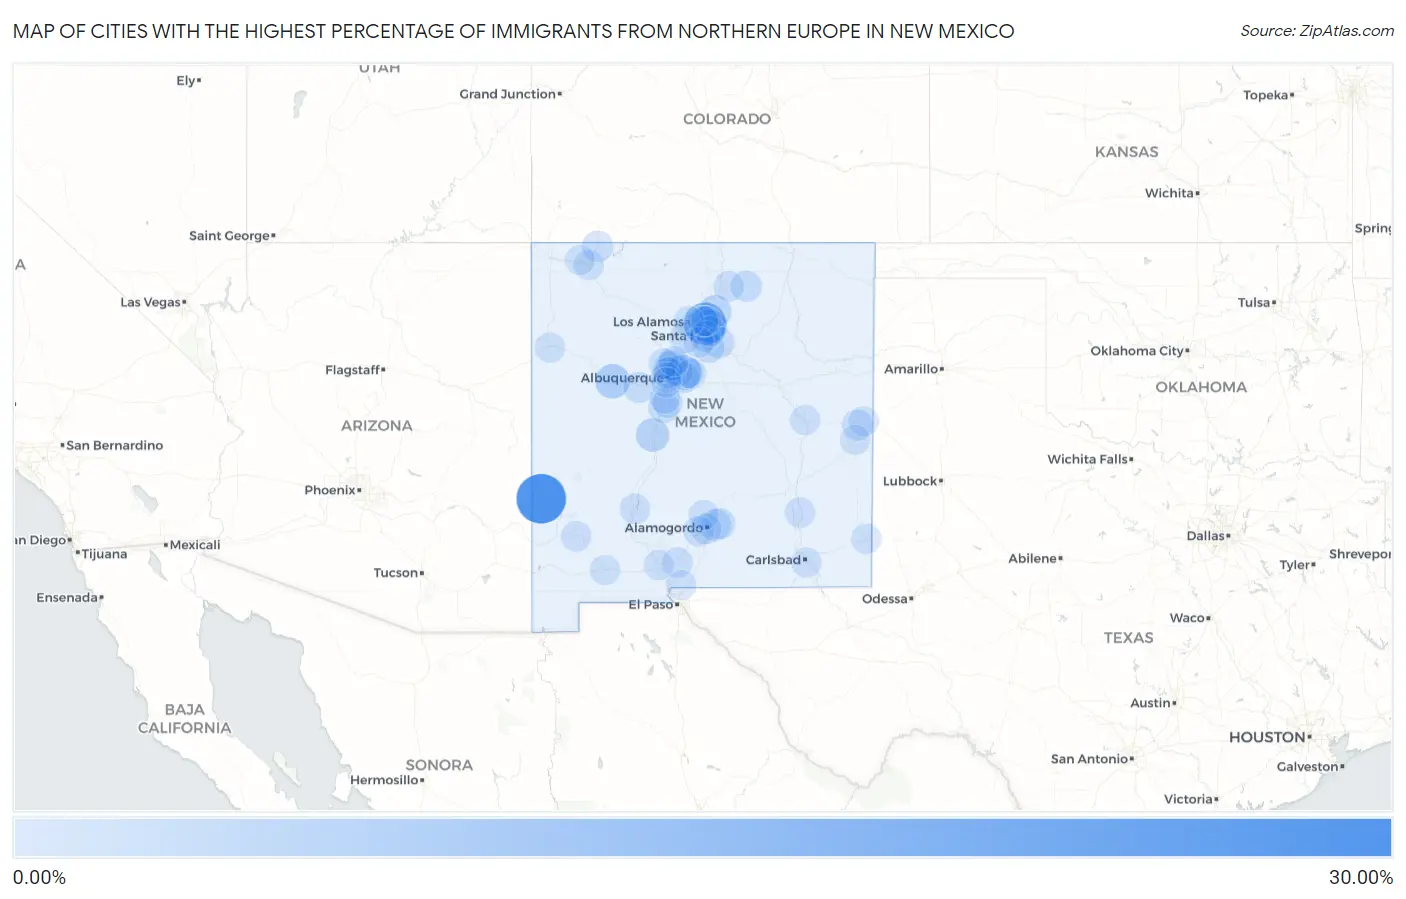
Map of Cities with the Highest Percentage of Immigrants from Northern Europe in New Mexico
0.00%
30.00%
Cities with the Highest Percentage of Immigrants from Northern Europe in New Mexico
| City | Northern Europe | vs State | vs National | |
| 1. | Glenwood | 25.93% | 0.19%(+25.7)#1 | 0.29%(+25.6)#4 |
| 2. | Cuyamungue Grant | 16.07% | 0.19%(+15.9)#2 | 0.29%(+15.8)#12 |
| 3. | Sandia Park | 6.08% | 0.19%(+5.89)#3 | 0.29%(+5.80)#68 |
| 4. | Skyline Ganipa | 5.48% | 0.19%(+5.29)#4 | 0.29%(+5.19)#80 |
| 5. | Chupadero | 4.56% | 0.19%(+4.37)#5 | 0.29%(+4.28)#114 |
| 6. | Alamillo | 4.05% | 0.19%(+3.86)#6 | 0.29%(+3.76)#155 |
| 7. | Truchas | 3.12% | 0.19%(+2.93)#7 | 0.29%(+2.84)#257 |
| 8. | Santa Fe Foothills | 2.95% | 0.19%(+2.75)#8 | 0.29%(+2.66)#283 |
| 9. | Las Campanas | 2.37% | 0.19%(+2.18)#9 | 0.29%(+2.08)#415 |
| 10. | Tres Arroyos | 2.17% | 0.19%(+1.98)#10 | 0.29%(+1.89)#468 |
| 11. | Sunlit Hills | 2.04% | 0.19%(+1.85)#11 | 0.29%(+1.75)#522 |
| 12. | High Rolls | 1.80% | 0.19%(+1.61)#12 | 0.29%(+1.51)#630 |
| 13. | Glorieta | 1.64% | 0.19%(+1.45)#13 | 0.29%(+1.35)#719 |
| 14. | Picacho Hills | 1.26% | 0.19%(+1.07)#14 | 0.29%(+0.977)#1,054 |
| 15. | Barton | 1.24% | 0.19%(+1.04)#15 | 0.29%(+0.950)#1,086 |
| 16. | Tano Road | 1.20% | 0.19%(+1.00)#16 | 0.29%(+0.910)#1,142 |
| 17. | Rio Communities | 1.18% | 0.19%(+0.990)#17 | 0.29%(+0.895)#1,164 |
| 18. | Angel Fire | 1.14% | 0.19%(+0.951)#18 | 0.29%(+0.857)#1,220 |
| 19. | Tijeras | 1.11% | 0.19%(+0.922)#19 | 0.29%(+0.828)#1,262 |
| 20. | Eldorado At Santa Fe | 1.10% | 0.19%(+0.906)#20 | 0.29%(+0.811)#1,285 |
| 21. | Cedar Hill | 1.07% | 0.19%(+0.883)#21 | 0.29%(+0.789)#1,329 |
| 22. | Cochiti Lake | 1.07% | 0.19%(+0.882)#22 | 0.29%(+0.788)#1,334 |
| 23. | Cloudcroft | 1.04% | 0.19%(+0.853)#23 | 0.29%(+0.759)#1,386 |
| 24. | Cannon Afb | 1.04% | 0.19%(+0.853)#24 | 0.29%(+0.759)#1,387 |
| 25. | San Antonito Cdp Bernalillo County | 1.04% | 0.19%(+0.845)#25 | 0.29%(+0.751)#1,397 |
| 26. | Highland Meadows | 0.97% | 0.19%(+0.782)#26 | 0.29%(+0.688)#1,523 |
| 27. | Jacona | 0.83% | 0.19%(+0.642)#27 | 0.29%(+0.548)#1,867 |
| 28. | Alamogordo | 0.72% | 0.19%(+0.525)#28 | 0.29%(+0.431)#2,207 |
| 29. | Sandia Knolls | 0.64% | 0.19%(+0.447)#29 | 0.29%(+0.353)#2,481 |
| 30. | Las Maravillas | 0.61% | 0.19%(+0.422)#30 | 0.29%(+0.327)#2,593 |
| 31. | Elephant Butte | 0.57% | 0.19%(+0.381)#31 | 0.29%(+0.287)#2,791 |
| 32. | Corrales | 0.55% | 0.19%(+0.362)#32 | 0.29%(+0.268)#2,874 |
| 33. | Sandia Heights | 0.53% | 0.19%(+0.340)#33 | 0.29%(+0.245)#2,987 |
| 34. | Santa Fe | 0.52% | 0.19%(+0.327)#34 | 0.29%(+0.233)#3,059 |
| 35. | Silver City | 0.51% | 0.19%(+0.317)#35 | 0.29%(+0.222)#3,103 |
| 36. | North Valley | 0.51% | 0.19%(+0.316)#36 | 0.29%(+0.221)#3,109 |
| 37. | Taos | 0.50% | 0.19%(+0.305)#37 | 0.29%(+0.210)#3,169 |
| 38. | White Sands | 0.41% | 0.19%(+0.223)#38 | 0.29%(+0.129)#3,683 |
| 39. | Pueblo Of Sandia Village | 0.39% | 0.19%(+0.197)#39 | 0.29%(+0.103)#3,901 |
| 40. | Los Ranchos De Albuquerque | 0.36% | 0.19%(+0.165)#40 | 0.29%(+0.071)#4,166 |
| 41. | Tesuque | 0.36% | 0.19%(+0.165)#41 | 0.29%(+0.071)#4,169 |
| 42. | La Cienega | 0.30% | 0.19%(+0.113)#42 | 0.29%(+0.019)#4,644 |
| 43. | Pojoaque | 0.30% | 0.19%(+0.109)#43 | 0.29%(+0.014)#4,688 |
| 44. | Holloman Afb | 0.29% | 0.19%(+0.096)#44 | 0.29%(+0.002)#4,835 |
| 45. | Hagerman | 0.27% | 0.19%(+0.083)#45 | 0.29%(-0.011)#4,951 |
| 46. | Rio Rancho | 0.26% | 0.19%(+0.067)#46 | 0.29%(-0.028)#5,135 |
| 47. | El Cerro | 0.25% | 0.19%(+0.056)#47 | 0.29%(-0.039)#5,272 |
| 48. | Los Alamos | 0.24% | 0.19%(+0.047)#48 | 0.29%(-0.048)#5,379 |
| 49. | Albuquerque | 0.21% | 0.19%(+0.022)#49 | 0.29%(-0.072)#5,707 |
| 50. | Deming | 0.20% | 0.19%(+0.012)#50 | 0.29%(-0.082)#5,833 |
| 51. | Tularosa | 0.19% | 0.19%(+0.002)#51 | 0.29%(-0.092)#5,991 |
| 52. | West Hammond | 0.17% | 0.19%(-0.025)#52 | 0.29%(-0.119)#6,387 |
| 53. | Fort Sumner | 0.17% | 0.19%(-0.025)#53 | 0.29%(-0.120)#6,392 |
| 54. | Edgewood | 0.16% | 0.19%(-0.027)#54 | 0.29%(-0.122)#6,419 |
| 55. | Bernalillo | 0.16% | 0.19%(-0.029)#55 | 0.29%(-0.124)#6,447 |
| 56. | Carlsbad | 0.14% | 0.19%(-0.055)#56 | 0.29%(-0.150)#6,798 |
| 57. | Clovis | 0.11% | 0.19%(-0.076)#57 | 0.29%(-0.171)#7,068 |
| 58. | Hobbs | 0.098% | 0.19%(-0.093)#58 | 0.29%(-0.187)#7,328 |
| 59. | Portales | 0.091% | 0.19%(-0.100)#59 | 0.29%(-0.194)#7,404 |
| 60. | Las Cruces | 0.068% | 0.19%(-0.123)#60 | 0.29%(-0.217)#7,741 |
| 61. | Farmington | 0.060% | 0.19%(-0.131)#61 | 0.29%(-0.225)#7,845 |
| 62. | Espanola | 0.057% | 0.19%(-0.134)#62 | 0.29%(-0.228)#7,882 |
| 63. | Nambe | 0.046% | 0.19%(-0.145)#63 | 0.29%(-0.239)#8,017 |
| 64. | South Valley | 0.037% | 0.19%(-0.154)#64 | 0.29%(-0.248)#8,112 |
| 65. | Gallup | 0.014% | 0.19%(-0.177)#65 | 0.29%(-0.272)#8,295 |
| 66. | Chaparral | 0.013% | 0.19%(-0.178)#66 | 0.29%(-0.272)#8,299 |
Common Questions
What are the Top 10 Cities with the Highest Percentage of Immigrants from Northern Europe in New Mexico?
Top 10 Cities with the Highest Percentage of Immigrants from Northern Europe in New Mexico are:
#1
25.93%
#2
16.07%
#3
6.08%
#4
5.48%
#5
4.56%
#6
4.05%
#7
3.12%
#8
1.80%
#9
1.64%
#10
1.18%
What city has the Highest Percentage of Immigrants from Northern Europe in New Mexico?
Glenwood has the Highest Percentage of Immigrants from Northern Europe in New Mexico with 25.93%.
What is the Percentage of Immigrants from Northern Europe in the State of New Mexico?
Percentage of Immigrants from Northern Europe in New Mexico is 0.19%.
What is the Percentage of Immigrants from Northern Europe in the United States?
Percentage of Immigrants from Northern Europe in the United States is 0.29%.