States with the Highest Percentage of Immigrants from Northern Europe
RELATED REPORTS & OPTIONS
Northern Europe
United States
Compare States
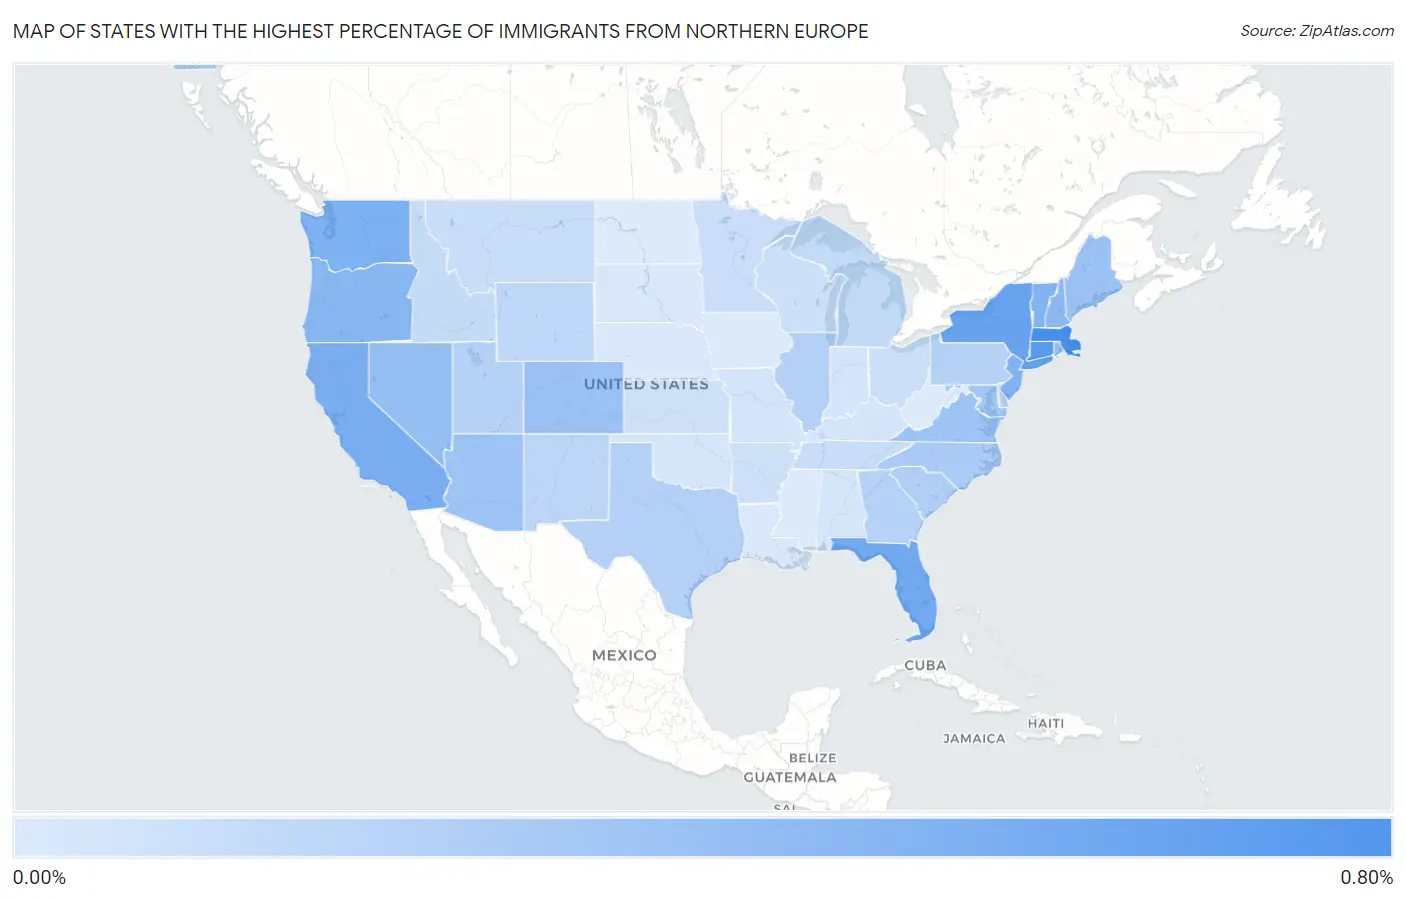
Map of States with the Highest Percentage of Immigrants from Northern Europe
0.00%
0.80%
States with the Highest Percentage of Immigrants from Northern Europe in the United States
| State | Northern Europe | vs State Median | vs National | |
| 1. | Massachusetts | 0.62% | 0.21% (+0.401) | 0.29%(+0.330) |
| 2. | Connecticut | 0.56% | 0.21% (+0.340) | 0.29%(+0.270) |
| 3. | New York | 0.49% | 0.21% (+0.280) | 0.29%(+0.210) |
| 4. | Florida | 0.46% | 0.21% (+0.243) | 0.29%(+0.172) |
| 5. | California | 0.43% | 0.21% (+0.217) | 0.29%(+0.146) |
| 6. | Washington | 0.42% | 0.21% (+0.201) | 0.29%(+0.130) |
| 7. | New Jersey | 0.41% | 0.21% (+0.194) | 0.29%(+0.123) |
| 8. | Vermont | 0.40% | 0.21% (+0.187) | 0.29%(+0.117) |
| 9. | Oregon | 0.38% | 0.21% (+0.167) | 0.29%(+0.097) |
| 10. | New Hampshire | 0.37% | 0.21% (+0.155) | 0.29%(+0.084) |
| 11. | Rhode Island | 0.33% | 0.21% (+0.117) | 0.29%(+0.047) |
| 12. | Nevada | 0.33% | 0.21% (+0.115) | 0.29%(+0.044) |
| 13. | Colorado | 0.31% | 0.21% (+0.095) | 0.29%(+0.024) |
| 14. | Maine | 0.30% | 0.21% (+0.090) | 0.29%(+0.019) |
| 15. | Virginia | 0.30% | 0.21% (+0.084) | 0.29%(+0.013) |
| 16. | Arizona | 0.30% | 0.21% (+0.081) | 0.29%(+0.011) |
| 17. | Maryland | 0.28% | 0.21% (+0.070) | 0.29%(-0.001) |
| 18. | North Carolina | 0.25% | 0.21% (+0.040) | 0.29%(-0.031) |
| 19. | Delaware | 0.24% | 0.21% (+0.020) | 0.29%(-0.050) |
| 20. | South Carolina | 0.23% | 0.21% (+0.019) | 0.29%(-0.051) |
| 21. | Illinois | 0.23% | 0.21% (+0.014) | 0.29%(-0.057) |
| 22. | Texas | 0.23% | 0.21% (+0.012) | 0.29%(-0.058) |
| 23. | Pennsylvania | 0.22% | 0.21% (+0.002) | 0.29%(-0.068) |
| 24. | Hawaii | 0.22% | 0.21% (+0.002) | 0.29%(-0.069) |
| 25. | Utah | 0.21% | 0.21% (+0.000) | 0.29%(-0.071) |
| 26. | Georgia | 0.21% | 0.21% (-0.000) | 0.29%(-0.071) |
| 27. | Alaska | 0.21% | 0.21% (-0.002) | 0.29%(-0.073) |
| 28. | New Mexico | 0.19% | 0.21% (-0.024) | 0.29%(-0.095) |
| 29. | Wyoming | 0.18% | 0.21% (-0.034) | 0.29%(-0.105) |
| 30. | Michigan | 0.17% | 0.21% (-0.050) | 0.29%(-0.120) |
| 31. | Idaho | 0.16% | 0.21% (-0.053) | 0.29%(-0.123) |
| 32. | Tennessee | 0.15% | 0.21% (-0.064) | 0.29%(-0.134) |
| 33. | Montana | 0.15% | 0.21% (-0.068) | 0.29%(-0.139) |
| 34. | Minnesota | 0.14% | 0.21% (-0.072) | 0.29%(-0.142) |
| 35. | Ohio | 0.13% | 0.21% (-0.080) | 0.29%(-0.151) |
| 36. | Wisconsin | 0.13% | 0.21% (-0.084) | 0.29%(-0.155) |
| 37. | Arkansas | 0.13% | 0.21% (-0.088) | 0.29%(-0.158) |
| 38. | Kansas | 0.12% | 0.21% (-0.092) | 0.29%(-0.162) |
| 39. | Kentucky | 0.11% | 0.21% (-0.105) | 0.29%(-0.176) |
| 40. | Indiana | 0.11% | 0.21% (-0.105) | 0.29%(-0.176) |
| 41. | Missouri | 0.11% | 0.21% (-0.109) | 0.29%(-0.180) |
| 42. | Alabama | 0.10% | 0.21% (-0.112) | 0.29%(-0.183) |
| 43. | Oklahoma | 0.10% | 0.21% (-0.113) | 0.29%(-0.183) |
| 44. | Nebraska | 0.086% | 0.21% (-0.129) | 0.29%(-0.199) |
| 45. | South Dakota | 0.084% | 0.21% (-0.131) | 0.29%(-0.201) |
| 46. | Louisiana | 0.081% | 0.21% (-0.134) | 0.29%(-0.204) |
| 47. | Iowa | 0.079% | 0.21% (-0.136) | 0.29%(-0.206) |
| 48. | North Dakota | 0.076% | 0.21% (-0.139) | 0.29%(-0.210) |
| 49. | Mississippi | 0.075% | 0.21% (-0.140) | 0.29%(-0.210) |
| 50. | West Virginia | 0.075% | 0.21% (-0.140) | 0.29%(-0.210) |
1
Common Questions
What are the Top 10 States with the Highest Percentage of Immigrants from Northern Europe in the United States?
Top 10 States with the Highest Percentage of Immigrants from Northern Europe in the United States are:
#1
0.62%
#2
0.56%
#3
0.49%
#4
0.46%
#5
0.43%
#6
0.42%
#7
0.41%
#8
0.40%
#9
0.38%
#10
0.37%
What state has the Highest Percentage of Immigrants from Northern Europe in the United States?
Massachusetts has the Highest Percentage of Immigrants from Northern Europe in the United States with 0.62%.
What is the Percentage of Immigrants from Northern Europe in the United States?
Percentage of Immigrants from Northern Europe in the United States is 0.29%.