Cities with the Highest Percentage of Immigrants from Northern Europe in Iowa
RELATED REPORTS & OPTIONS
Northern Europe
Iowa
Compare Cities
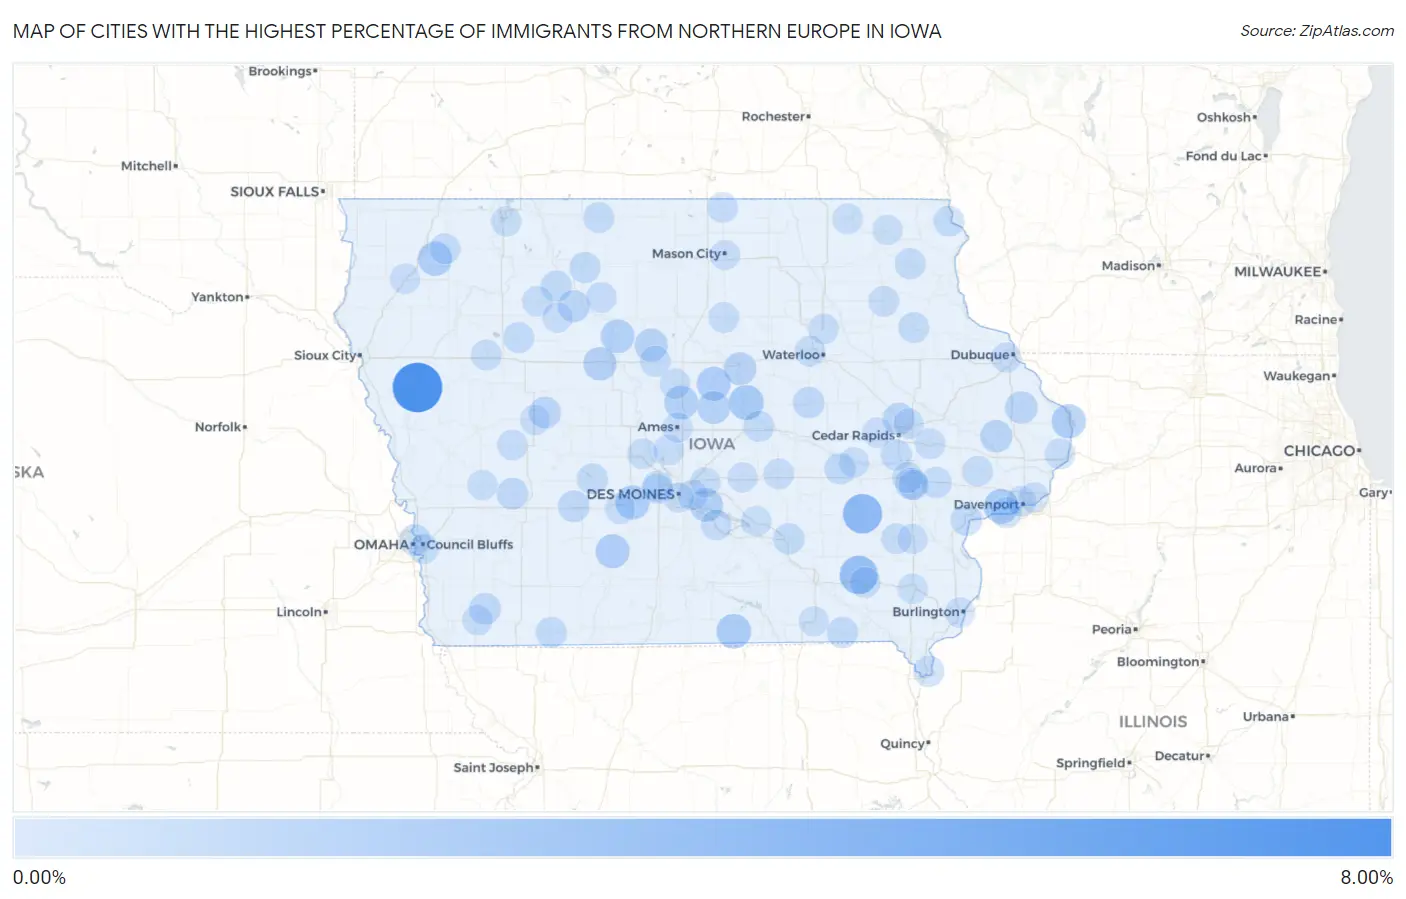
Map of Cities with the Highest Percentage of Immigrants from Northern Europe in Iowa
0.00%
8.00%
Cities with the Highest Percentage of Immigrants from Northern Europe in Iowa
| City | Northern Europe | vs State | vs National | |
| 1. | Oto | 6.25% | 0.079%(+6.17)#1 | 0.29%(+5.96)#66 |
| 2. | Kinross | 2.88% | 0.079%(+2.81)#2 | 0.29%(+2.60)#292 |
| 3. | Maharishi Vedic City | 2.55% | 0.079%(+2.47)#3 | 0.29%(+2.26)#380 |
| 4. | Kent Estates | 1.57% | 0.079%(+1.49)#4 | 0.29%(+1.28)#772 |
| 5. | Liscomb | 1.54% | 0.079%(+1.46)#5 | 0.29%(+1.26)#788 |
| 6. | Blue Grass | 1.44% | 0.079%(+1.36)#6 | 0.29%(+1.16)#876 |
| 7. | Seymour | 1.43% | 0.079%(+1.35)#7 | 0.29%(+1.15)#881 |
| 8. | De Soto | 1.30% | 0.079%(+1.22)#8 | 0.29%(+1.01)#1,015 |
| 9. | Archer | 1.28% | 0.079%(+1.20)#9 | 0.29%(+0.997)#1,030 |
| 10. | Sabula | 1.28% | 0.079%(+1.20)#10 | 0.29%(+0.992)#1,032 |
| 11. | Macksburg | 1.23% | 0.079%(+1.16)#11 | 0.29%(+0.949)#1,088 |
| 12. | Hubbard | 1.20% | 0.079%(+1.13)#12 | 0.29%(+0.919)#1,126 |
| 13. | Story City | 1.16% | 0.079%(+1.08)#13 | 0.29%(+0.878)#1,190 |
| 14. | Badger | 1.16% | 0.079%(+1.08)#14 | 0.29%(+0.871)#1,200 |
| 15. | Moorland | 1.08% | 0.079%(+0.996)#15 | 0.29%(+0.790)#1,325 |
| 16. | Runnells | 1.03% | 0.079%(+0.952)#16 | 0.29%(+0.746)#1,407 |
| 17. | Woolstock | 0.94% | 0.079%(+0.864)#17 | 0.29%(+0.658)#1,598 |
| 18. | Zearing | 0.92% | 0.079%(+0.837)#18 | 0.29%(+0.631)#1,647 |
| 19. | Steamboat Rock | 0.85% | 0.079%(+0.772)#19 | 0.29%(+0.566)#1,815 |
| 20. | Andrew | 0.74% | 0.079%(+0.665)#20 | 0.29%(+0.459)#2,125 |
| 21. | Lost Nation | 0.74% | 0.079%(+0.658)#21 | 0.29%(+0.452)#2,144 |
| 22. | Rolfe | 0.60% | 0.079%(+0.522)#22 | 0.29%(+0.316)#2,637 |
| 23. | Robins | 0.60% | 0.079%(+0.517)#23 | 0.29%(+0.311)#2,663 |
| 24. | University Heights | 0.59% | 0.079%(+0.512)#24 | 0.29%(+0.306)#2,688 |
| 25. | Lidderdale | 0.58% | 0.079%(+0.506)#25 | 0.29%(+0.299)#2,724 |
| 26. | Carter Lake | 0.56% | 0.079%(+0.476)#26 | 0.29%(+0.270)#2,868 |
| 27. | Elk Horn | 0.55% | 0.079%(+0.472)#27 | 0.29%(+0.266)#2,884 |
| 28. | Essex | 0.55% | 0.079%(+0.472)#28 | 0.29%(+0.266)#2,886 |
| 29. | Casey | 0.53% | 0.079%(+0.454)#29 | 0.29%(+0.248)#2,971 |
| 30. | Traer | 0.49% | 0.079%(+0.406)#30 | 0.29%(+0.200)#3,221 |
| 31. | Muscatine | 0.45% | 0.079%(+0.369)#31 | 0.29%(+0.162)#3,456 |
| 32. | Milton | 0.40% | 0.079%(+0.324)#32 | 0.29%(+0.118)#3,775 |
| 33. | Mallard | 0.40% | 0.079%(+0.319)#33 | 0.29%(+0.113)#3,823 |
| 34. | Oskaloosa | 0.39% | 0.079%(+0.312)#34 | 0.29%(+0.106)#3,870 |
| 35. | Ladora | 0.39% | 0.079%(+0.311)#35 | 0.29%(+0.105)#3,880 |
| 36. | Whittemore | 0.37% | 0.079%(+0.293)#36 | 0.29%(+0.087)#4,042 |
| 37. | West Branch | 0.36% | 0.079%(+0.280)#37 | 0.29%(+0.074)#4,133 |
| 38. | Swisher | 0.36% | 0.079%(+0.276)#38 | 0.29%(+0.070)#4,177 |
| 39. | Keokuk | 0.35% | 0.079%(+0.275)#39 | 0.29%(+0.069)#4,182 |
| 40. | Bedford | 0.35% | 0.079%(+0.274)#40 | 0.29%(+0.068)#4,194 |
| 41. | Newell | 0.34% | 0.079%(+0.257)#41 | 0.29%(+0.051)#4,342 |
| 42. | Postville | 0.30% | 0.079%(+0.222)#42 | 0.29%(+0.016)#4,664 |
| 43. | Buffalo | 0.30% | 0.079%(+0.222)#43 | 0.29%(+0.016)#4,667 |
| 44. | Marshalltown | 0.30% | 0.079%(+0.219)#44 | 0.29%(+0.013)#4,698 |
| 45. | Webster City | 0.30% | 0.079%(+0.216)#45 | 0.29%(+0.010)#4,725 |
| 46. | Swea City | 0.29% | 0.079%(+0.211)#46 | 0.29%(+0.004)#4,803 |
| 47. | Urbandale | 0.29% | 0.079%(+0.210)#47 | 0.29%(+0.004)#4,809 |
| 48. | Lansing | 0.28% | 0.079%(+0.206)#48 | 0.29%(-0.000)#4,859 |
| 49. | Strawberry Point | 0.28% | 0.079%(+0.201)#49 | 0.29%(-0.005)#4,900 |
| 50. | Panora | 0.27% | 0.079%(+0.189)#50 | 0.29%(-0.017)#5,021 |
| 51. | Sanborn | 0.26% | 0.079%(+0.181)#51 | 0.29%(-0.025)#5,110 |
| 52. | Coralville | 0.26% | 0.079%(+0.179)#52 | 0.29%(-0.028)#5,134 |
| 53. | Bode | 0.26% | 0.079%(+0.177)#53 | 0.29%(-0.029)#5,157 |
| 54. | Fayette | 0.25% | 0.079%(+0.175)#54 | 0.29%(-0.031)#5,176 |
| 55. | Hampton | 0.25% | 0.079%(+0.175)#55 | 0.29%(-0.031)#5,183 |
| 56. | Fairfield | 0.25% | 0.079%(+0.174)#56 | 0.29%(-0.032)#5,193 |
| 57. | Laurens | 0.25% | 0.079%(+0.166)#57 | 0.29%(-0.040)#5,291 |
| 58. | Bennett | 0.24% | 0.079%(+0.161)#58 | 0.29%(-0.045)#5,336 |
| 59. | Cedar Falls | 0.24% | 0.079%(+0.159)#59 | 0.29%(-0.047)#5,373 |
| 60. | Schaller | 0.24% | 0.079%(+0.158)#60 | 0.29%(-0.048)#5,392 |
| 61. | Jewell Junction | 0.23% | 0.079%(+0.154)#61 | 0.29%(-0.052)#5,427 |
| 62. | Grinnell | 0.22% | 0.079%(+0.142)#62 | 0.29%(-0.065)#5,601 |
| 63. | Pleasantville | 0.22% | 0.079%(+0.138)#63 | 0.29%(-0.068)#5,657 |
| 64. | Lisbon | 0.21% | 0.079%(+0.134)#64 | 0.29%(-0.072)#5,697 |
| 65. | Manning | 0.21% | 0.079%(+0.128)#65 | 0.29%(-0.078)#5,777 |
| 66. | Woodward | 0.20% | 0.079%(+0.123)#66 | 0.29%(-0.083)#5,846 |
| 67. | Slater | 0.19% | 0.079%(+0.115)#67 | 0.29%(-0.091)#5,978 |
| 68. | Clinton | 0.19% | 0.079%(+0.112)#68 | 0.29%(-0.094)#6,009 |
| 69. | Washington | 0.19% | 0.079%(+0.112)#69 | 0.29%(-0.094)#6,016 |
| 70. | Northwood | 0.19% | 0.079%(+0.107)#70 | 0.29%(-0.099)#6,087 |
| 71. | Marengo | 0.18% | 0.079%(+0.099)#71 | 0.29%(-0.108)#6,211 |
| 72. | Pleasant Hill | 0.16% | 0.079%(+0.083)#72 | 0.29%(-0.123)#6,430 |
| 73. | Shenandoah | 0.16% | 0.079%(+0.083)#73 | 0.29%(-0.123)#6,434 |
| 74. | Denver | 0.16% | 0.079%(+0.077)#74 | 0.29%(-0.129)#6,523 |
| 75. | Alton | 0.16% | 0.079%(+0.077)#75 | 0.29%(-0.130)#6,527 |
| 76. | Cresco | 0.15% | 0.079%(+0.075)#76 | 0.29%(-0.132)#6,546 |
| 77. | Iowa City | 0.15% | 0.079%(+0.074)#77 | 0.29%(-0.132)#6,554 |
| 78. | Earlham | 0.15% | 0.079%(+0.067)#78 | 0.29%(-0.139)#6,651 |
| 79. | Carroll | 0.14% | 0.079%(+0.057)#79 | 0.29%(-0.149)#6,779 |
| 80. | Bettendorf | 0.14% | 0.079%(+0.057)#80 | 0.29%(-0.149)#6,785 |
| 81. | Atkins | 0.13% | 0.079%(+0.051)#81 | 0.29%(-0.155)#6,859 |
| 82. | Ainsworth | 0.13% | 0.079%(+0.049)#82 | 0.29%(-0.157)#6,899 |
| 83. | Pocahontas | 0.12% | 0.079%(+0.045)#83 | 0.29%(-0.161)#6,942 |
| 84. | Clive | 0.12% | 0.079%(+0.045)#84 | 0.29%(-0.162)#6,943 |
| 85. | Marion | 0.12% | 0.079%(+0.044)#85 | 0.29%(-0.162)#6,952 |
| 86. | Pella | 0.12% | 0.079%(+0.044)#86 | 0.29%(-0.162)#6,953 |
| 87. | Harlan | 0.12% | 0.079%(+0.043)#87 | 0.29%(-0.163)#6,961 |
| 88. | Mitchellville | 0.12% | 0.079%(+0.040)#88 | 0.29%(-0.166)#6,998 |
| 89. | Ames | 0.12% | 0.079%(+0.038)#89 | 0.29%(-0.168)#7,020 |
| 90. | Mason City | 0.10% | 0.079%(+0.023)#90 | 0.29%(-0.183)#7,247 |
| 91. | Arnolds Park | 0.10% | 0.079%(+0.022)#91 | 0.29%(-0.184)#7,279 |
| 92. | Council Bluffs | 0.10% | 0.079%(+0.021)#92 | 0.29%(-0.185)#7,290 |
| 93. | Davenport | 0.096% | 0.079%(+0.016)#93 | 0.29%(-0.190)#7,355 |
| 94. | Dubuque | 0.093% | 0.079%(+0.013)#94 | 0.29%(-0.193)#7,385 |
| 95. | Des Moines | 0.091% | 0.079%(+0.012)#95 | 0.29%(-0.194)#7,405 |
| 96. | Mount Pleasant | 0.087% | 0.079%(+0.008)#96 | 0.29%(-0.199)#7,481 |
| 97. | Newton | 0.083% | 0.079%(+0.004)#97 | 0.29%(-0.203)#7,540 |
| 98. | Burlington | 0.079% | 0.079%(-0.000)#98 | 0.29%(-0.206)#7,583 |
| 99. | Decorah | 0.079% | 0.079%(-0.000)#99 | 0.29%(-0.207)#7,587 |
| 100. | Bloomfield | 0.074% | 0.079%(-0.005)#100 | 0.29%(-0.211)#7,657 |
Common Questions
What are the Top 10 Cities with the Highest Percentage of Immigrants from Northern Europe in Iowa?
Top 10 Cities with the Highest Percentage of Immigrants from Northern Europe in Iowa are:
#1
6.25%
#2
2.88%
#3
2.55%
#4
1.54%
#5
1.44%
#6
1.43%
#7
1.30%
#8
1.28%
#9
1.28%
#10
1.23%
What city has the Highest Percentage of Immigrants from Northern Europe in Iowa?
Oto has the Highest Percentage of Immigrants from Northern Europe in Iowa with 6.25%.
What is the Percentage of Immigrants from Northern Europe in the State of Iowa?
Percentage of Immigrants from Northern Europe in Iowa is 0.079%.
What is the Percentage of Immigrants from Northern Europe in the United States?
Percentage of Immigrants from Northern Europe in the United States is 0.29%.