Cities with the Highest Percentage of Immigrants from Northern Europe in Kentucky
RELATED REPORTS & OPTIONS
Northern Europe
Kentucky
Compare Cities
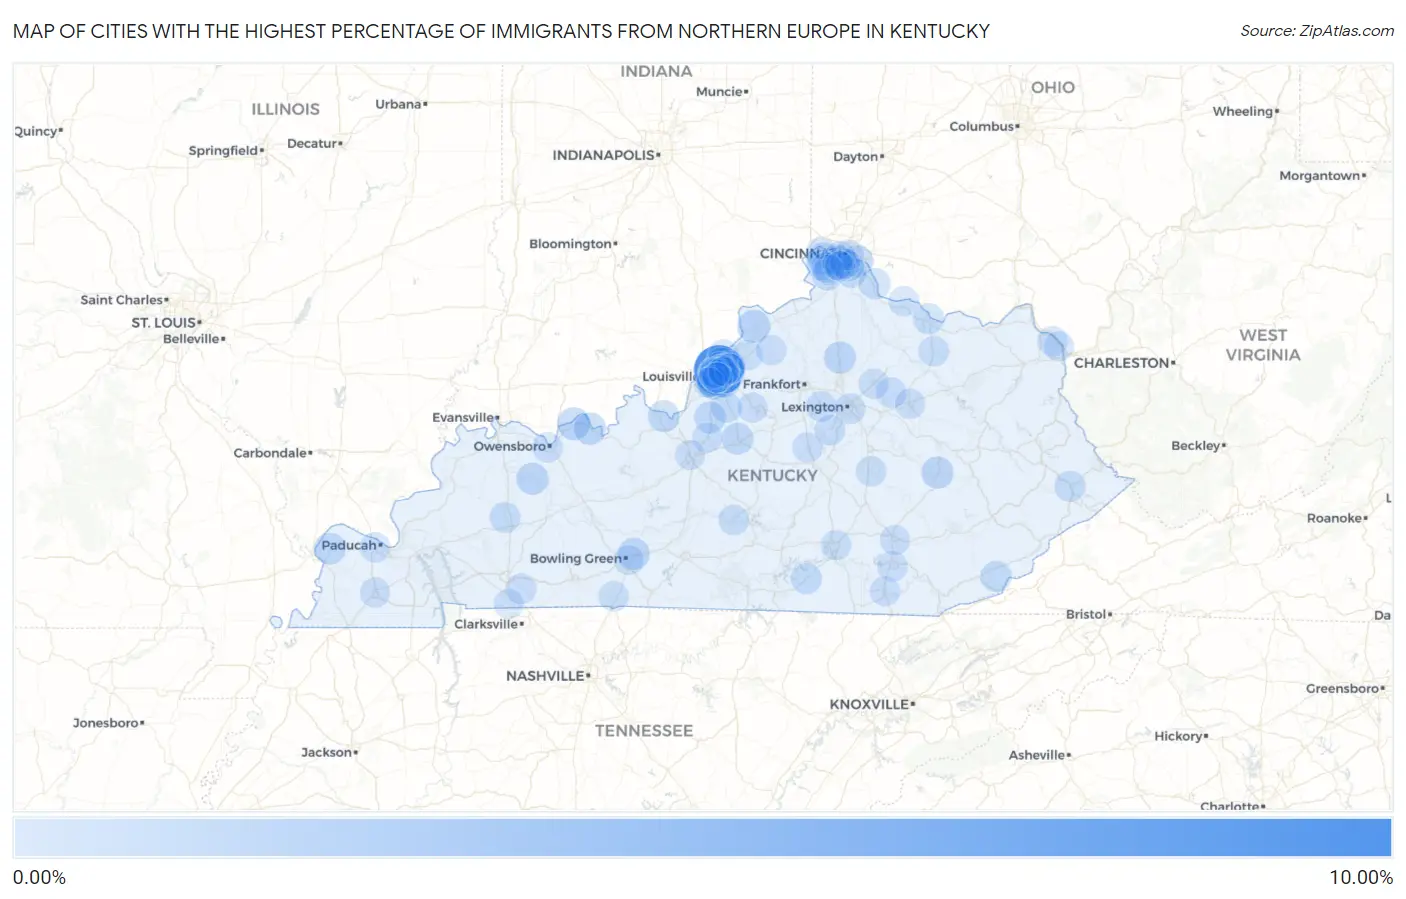
Map of Cities with the Highest Percentage of Immigrants from Northern Europe in Kentucky
0.00%
10.00%
Cities with the Highest Percentage of Immigrants from Northern Europe in Kentucky
| City | Northern Europe | vs State | vs National | |
| 1. | Hills And Dales | 9.38% | 0.11%(+9.27)#1 | 0.29%(+9.09)#37 |
| 2. | Wellington | 1.81% | 0.11%(+1.70)#2 | 0.29%(+1.52)#625 |
| 3. | Hickory Hill | 1.68% | 0.11%(+1.57)#3 | 0.29%(+1.40)#695 |
| 4. | Richlawn | 1.66% | 0.11%(+1.55)#4 | 0.29%(+1.38)#708 |
| 5. | Briarwood | 1.56% | 0.11%(+1.45)#5 | 0.29%(+1.27)#776 |
| 6. | Ten Broeck | 1.37% | 0.11%(+1.26)#6 | 0.29%(+1.08)#936 |
| 7. | Bedford | 1.32% | 0.11%(+1.21)#7 | 0.29%(+1.03)#990 |
| 8. | Lewisport | 1.24% | 0.11%(+1.13)#8 | 0.29%(+0.953)#1,081 |
| 9. | Riverwood | 1.20% | 0.11%(+1.09)#9 | 0.29%(+0.912)#1,135 |
| 10. | Anchorage | 1.07% | 0.11%(+0.965)#10 | 0.29%(+0.789)#1,327 |
| 11. | Hebron | 1.04% | 0.11%(+0.935)#11 | 0.29%(+0.759)#1,385 |
| 12. | Prospect | 1.02% | 0.11%(+0.907)#12 | 0.29%(+0.731)#1,443 |
| 13. | Lakeside Park | 0.99% | 0.11%(+0.880)#13 | 0.29%(+0.704)#1,496 |
| 14. | Calhoun | 0.96% | 0.11%(+0.851)#14 | 0.29%(+0.675)#1,553 |
| 15. | Hawesville | 0.96% | 0.11%(+0.849)#15 | 0.29%(+0.673)#1,558 |
| 16. | Strathmoor Village | 0.95% | 0.11%(+0.843)#16 | 0.29%(+0.667)#1,580 |
| 17. | Lincolnshire | 0.95% | 0.11%(+0.843)#17 | 0.29%(+0.667)#1,581 |
| 18. | Sadieville | 0.92% | 0.11%(+0.813)#18 | 0.29%(+0.638)#1,630 |
| 19. | Beattyville | 0.92% | 0.11%(+0.810)#19 | 0.29%(+0.635)#1,638 |
| 20. | Silver Grove | 0.90% | 0.11%(+0.789)#20 | 0.29%(+0.613)#1,690 |
| 21. | Plum Springs | 0.87% | 0.11%(+0.764)#21 | 0.29%(+0.588)#1,743 |
| 22. | Bardstown | 0.86% | 0.11%(+0.745)#22 | 0.29%(+0.570)#1,809 |
| 23. | Wildwood | 0.84% | 0.11%(+0.731)#23 | 0.29%(+0.555)#1,852 |
| 24. | Doe Valley | 0.75% | 0.11%(+0.638)#24 | 0.29%(+0.463)#2,114 |
| 25. | Shepherdsville | 0.74% | 0.11%(+0.626)#25 | 0.29%(+0.450)#2,147 |
| 26. | Barlow | 0.74% | 0.11%(+0.625)#26 | 0.29%(+0.450)#2,150 |
| 27. | Sycamore | 0.71% | 0.11%(+0.604)#27 | 0.29%(+0.429)#2,217 |
| 28. | Druid Hills | 0.63% | 0.11%(+0.521)#28 | 0.29%(+0.346)#2,508 |
| 29. | Evarts | 0.57% | 0.11%(+0.462)#29 | 0.29%(+0.287)#2,792 |
| 30. | Windy Hills | 0.55% | 0.11%(+0.437)#30 | 0.29%(+0.262)#2,916 |
| 31. | Graymoor Devondale | 0.53% | 0.11%(+0.417)#31 | 0.29%(+0.242)#3,007 |
| 32. | Maysville | 0.51% | 0.11%(+0.400)#32 | 0.29%(+0.224)#3,093 |
| 33. | Mentor | 0.48% | 0.11%(+0.371)#33 | 0.29%(+0.195)#3,249 |
| 34. | Pikeville | 0.48% | 0.11%(+0.366)#34 | 0.29%(+0.191)#3,274 |
| 35. | Union | 0.47% | 0.11%(+0.365)#35 | 0.29%(+0.190)#3,281 |
| 36. | Ryland Heights | 0.45% | 0.11%(+0.341)#36 | 0.29%(+0.165)#3,439 |
| 37. | Coldstream | 0.44% | 0.11%(+0.327)#37 | 0.29%(+0.151)#3,525 |
| 38. | Monticello | 0.43% | 0.11%(+0.323)#38 | 0.29%(+0.148)#3,546 |
| 39. | Mount Washington | 0.42% | 0.11%(+0.307)#39 | 0.29%(+0.132)#3,662 |
| 40. | Orchard Grass Hills | 0.41% | 0.11%(+0.303)#40 | 0.29%(+0.128)#3,692 |
| 41. | Earlington | 0.41% | 0.11%(+0.300)#41 | 0.29%(+0.125)#3,717 |
| 42. | Westwood | 0.40% | 0.11%(+0.293)#42 | 0.29%(+0.118)#3,774 |
| 43. | Crescent Springs | 0.39% | 0.11%(+0.281)#43 | 0.29%(+0.105)#3,877 |
| 44. | Manor Creek | 0.36% | 0.11%(+0.254)#44 | 0.29%(+0.078)#4,106 |
| 45. | Lexington | 0.36% | 0.11%(+0.246)#45 | 0.29%(+0.071)#4,170 |
| 46. | Blue Ridge Manor | 0.35% | 0.11%(+0.241)#46 | 0.29%(+0.066)#4,212 |
| 47. | Green Spring | 0.35% | 0.11%(+0.236)#47 | 0.29%(+0.060)#4,264 |
| 48. | Fincastle | 0.34% | 0.11%(+0.230)#48 | 0.29%(+0.055)#4,303 |
| 49. | Francisville | 0.34% | 0.11%(+0.229)#49 | 0.29%(+0.053)#4,319 |
| 50. | Brownsboro Village | 0.31% | 0.11%(+0.197)#50 | 0.29%(+0.021)#4,621 |
| 51. | Greensburg | 0.30% | 0.11%(+0.194)#51 | 0.29%(+0.018)#4,647 |
| 52. | Lyndon | 0.29% | 0.11%(+0.181)#52 | 0.29%(+0.006)#4,785 |
| 53. | Goshen | 0.29% | 0.11%(+0.179)#53 | 0.29%(+0.004)#4,812 |
| 54. | Taylor Mill | 0.28% | 0.11%(+0.168)#54 | 0.29%(-0.008)#4,925 |
| 55. | Versailles | 0.27% | 0.11%(+0.162)#55 | 0.29%(-0.013)#4,978 |
| 56. | Wilmore | 0.27% | 0.11%(+0.156)#56 | 0.29%(-0.019)#5,052 |
| 57. | North Middletown | 0.26% | 0.11%(+0.151)#57 | 0.29%(-0.024)#5,105 |
| 58. | Jeffersontown | 0.25% | 0.11%(+0.140)#58 | 0.29%(-0.035)#5,231 |
| 59. | Flemingsburg | 0.24% | 0.11%(+0.127)#59 | 0.29%(-0.049)#5,393 |
| 60. | Spring Valley | 0.23% | 0.11%(+0.123)#60 | 0.29%(-0.053)#5,440 |
| 61. | La Grange | 0.23% | 0.11%(+0.119)#61 | 0.29%(-0.057)#5,490 |
| 62. | New Castle | 0.23% | 0.11%(+0.117)#62 | 0.29%(-0.058)#5,504 |
| 63. | Plantation | 0.22% | 0.11%(+0.115)#63 | 0.29%(-0.061)#5,544 |
| 64. | Pembroke | 0.22% | 0.11%(+0.112)#64 | 0.29%(-0.063)#5,578 |
| 65. | Norbourne Estates | 0.22% | 0.11%(+0.106)#65 | 0.29%(-0.070)#5,670 |
| 66. | Bromley | 0.21% | 0.11%(+0.099)#66 | 0.29%(-0.076)#5,757 |
| 67. | Strathmoor Manor | 0.21% | 0.11%(+0.096)#67 | 0.29%(-0.080)#5,804 |
| 68. | Newport | 0.20% | 0.11%(+0.088)#68 | 0.29%(-0.088)#5,921 |
| 69. | Paris | 0.20% | 0.11%(+0.087)#69 | 0.29%(-0.088)#5,924 |
| 70. | Worthington Hills | 0.20% | 0.11%(+0.086)#70 | 0.29%(-0.090)#5,955 |
| 71. | Rolling Fields | 0.19% | 0.11%(+0.084)#71 | 0.29%(-0.092)#5,982 |
| 72. | Franklin | 0.19% | 0.11%(+0.078)#72 | 0.29%(-0.098)#6,077 |
| 73. | Berea | 0.18% | 0.11%(+0.072)#73 | 0.29%(-0.104)#6,157 |
| 74. | Corbin | 0.17% | 0.11%(+0.064)#74 | 0.29%(-0.111)#6,264 |
| 75. | London | 0.17% | 0.11%(+0.061)#75 | 0.29%(-0.115)#6,314 |
| 76. | Somerset | 0.17% | 0.11%(+0.057)#76 | 0.29%(-0.119)#6,377 |
| 77. | Bellefonte | 0.16% | 0.11%(+0.055)#77 | 0.29%(-0.121)#6,412 |
| 78. | Burlington | 0.16% | 0.11%(+0.049)#78 | 0.29%(-0.127)#6,488 |
| 79. | Williamsburg | 0.15% | 0.11%(+0.043)#79 | 0.29%(-0.132)#6,566 |
| 80. | Lebanon Junction | 0.14% | 0.11%(+0.034)#80 | 0.29%(-0.142)#6,693 |
| 81. | Florence | 0.14% | 0.11%(+0.031)#81 | 0.29%(-0.145)#6,737 |
| 82. | Indian Hills | 0.14% | 0.11%(+0.029)#82 | 0.29%(-0.147)#6,756 |
| 83. | Mount Sterling | 0.13% | 0.11%(+0.023)#83 | 0.29%(-0.153)#6,826 |
| 84. | Harrodsburg | 0.13% | 0.11%(+0.023)#84 | 0.29%(-0.153)#6,830 |
| 85. | Oakbrook | 0.13% | 0.11%(+0.020)#85 | 0.29%(-0.156)#6,879 |
| 86. | Augusta | 0.13% | 0.11%(+0.015)#86 | 0.29%(-0.160)#6,926 |
| 87. | Owensboro | 0.12% | 0.11%(+0.010)#87 | 0.29%(-0.165)#6,991 |
| 88. | Taylorsville | 0.12% | 0.11%(+0.007)#88 | 0.29%(-0.169)#7,033 |
| 89. | Covington | 0.11% | 0.11%(+0.003)#89 | 0.29%(-0.173)#7,096 |
| 90. | Louisville | 0.11% | 0.11%(+0.000)#90 | 0.29%(-0.175)#7,126 |
| 91. | Langdon Place | 0.11% | 0.11%(-0.003)#91 | 0.29%(-0.178)#7,169 |
| 92. | Elizabethtown | 0.099% | 0.11%(-0.011)#92 | 0.29%(-0.187)#7,321 |
| 93. | Ashland | 0.097% | 0.11%(-0.012)#93 | 0.29%(-0.188)#7,332 |
| 94. | Erlanger | 0.092% | 0.11%(-0.018)#94 | 0.29%(-0.193)#7,391 |
| 95. | Mayfield | 0.090% | 0.11%(-0.020)#95 | 0.29%(-0.195)#7,422 |
| 96. | Paducah | 0.089% | 0.11%(-0.020)#96 | 0.29%(-0.196)#7,431 |
| 97. | Edgewood | 0.083% | 0.11%(-0.027)#97 | 0.29%(-0.203)#7,539 |
| 98. | Bowling Green | 0.079% | 0.11%(-0.031)#98 | 0.29%(-0.207)#7,590 |
| 99. | Fort Campbell North | 0.075% | 0.11%(-0.035)#99 | 0.29%(-0.210)#7,645 |
| 100. | St Matthews | 0.074% | 0.11%(-0.036)#100 | 0.29%(-0.211)#7,663 |
Common Questions
What are the Top 10 Cities with the Highest Percentage of Immigrants from Northern Europe in Kentucky?
Top 10 Cities with the Highest Percentage of Immigrants from Northern Europe in Kentucky are:
#1
9.38%
#2
1.81%
#3
1.68%
#4
1.66%
#5
1.56%
#6
1.37%
#7
1.32%
#8
1.24%
#9
1.20%
#10
1.07%
What city has the Highest Percentage of Immigrants from Northern Europe in Kentucky?
Hills and Dales has the Highest Percentage of Immigrants from Northern Europe in Kentucky with 9.38%.
What is the Percentage of Immigrants from Northern Europe in the State of Kentucky?
Percentage of Immigrants from Northern Europe in Kentucky is 0.11%.
What is the Percentage of Immigrants from Northern Europe in the United States?
Percentage of Immigrants from Northern Europe in the United States is 0.29%.