Cities with the Highest Percentage of Population Employed in Wholesale Trade in Massachusetts
RELATED REPORTS & OPTIONS
Wholesale Trade
Massachusetts
Compare Cities
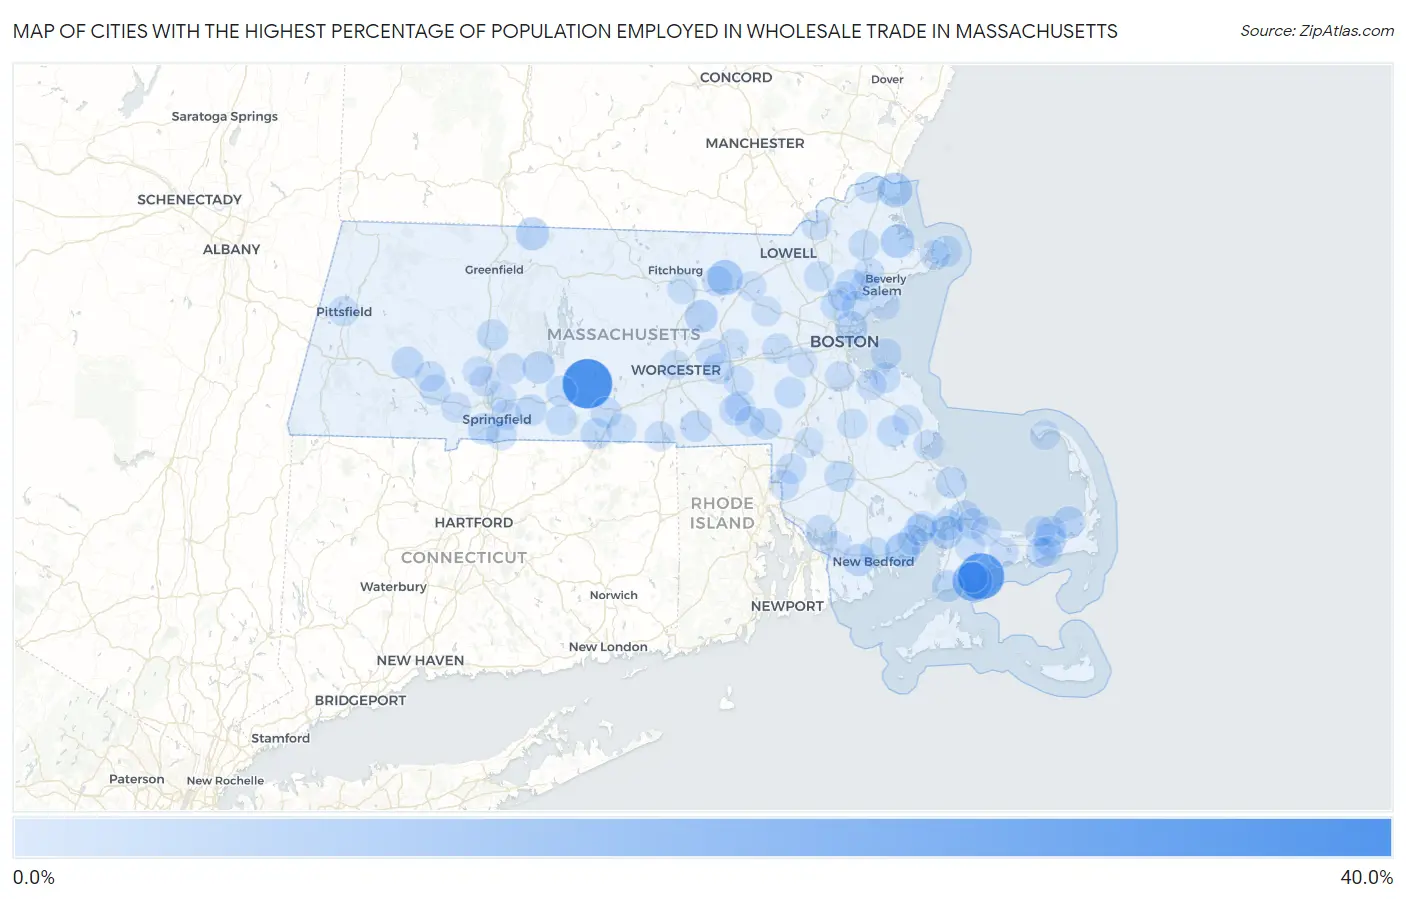
Map of Cities with the Highest Percentage of Population Employed in Wholesale Trade in Massachusetts
0.0%
40.0%
Cities with the Highest Percentage of Population Employed in Wholesale Trade in Massachusetts
| City | % Employed | vs State | vs National | |
| 1. | Warren | 31.2% | 2.0%(+29.1)#1 | 2.4%(+28.8)#99 |
| 2. | Popponesset Island | 25.6% | 2.0%(+23.6)#2 | 2.4%(+23.2)#138 |
| 3. | Monomoscoy Island | 16.2% | 2.0%(+14.1)#3 | 2.4%(+13.8)#366 |
| 4. | West Warren | 11.4% | 2.0%(+9.34)#4 | 2.4%(+8.96)#740 |
| 5. | Ayer | 9.5% | 2.0%(+7.52)#5 | 2.4%(+7.15)#1,037 |
| 6. | Mattapoisett Center | 8.7% | 2.0%(+6.67)#6 | 2.4%(+6.29)#1,242 |
| 7. | Salisbury | 8.6% | 2.0%(+6.55)#7 | 2.4%(+6.17)#1,283 |
| 8. | North Attleborough | 7.8% | 2.0%(+5.80)#8 | 2.4%(+5.42)#1,526 |
| 9. | Ipswich | 7.3% | 2.0%(+5.24)#9 | 2.4%(+4.87)#1,736 |
| 10. | Northfield | 6.5% | 2.0%(+4.43)#10 | 2.4%(+4.06)#2,174 |
| 11. | South Lancaster | 6.4% | 2.0%(+4.34)#11 | 2.4%(+3.96)#2,236 |
| 12. | Bourne | 6.3% | 2.0%(+4.24)#12 | 2.4%(+3.87)#2,299 |
| 13. | South Dennis | 6.0% | 2.0%(+4.00)#13 | 2.4%(+3.62)#2,478 |
| 14. | Chelsea | 5.6% | 2.0%(+3.58)#14 | 2.4%(+3.20)#2,819 |
| 15. | Smith Mills | 5.3% | 2.0%(+3.31)#15 | 2.4%(+2.94)#3,096 |
| 16. | Belchertown | 5.2% | 2.0%(+3.22)#16 | 2.4%(+2.84)#3,207 |
| 17. | Brewster | 5.2% | 2.0%(+3.14)#17 | 2.4%(+2.77)#3,291 |
| 18. | Chester | 4.7% | 2.0%(+2.72)#18 | 2.4%(+2.35)#3,818 |
| 19. | Sagamore | 4.6% | 2.0%(+2.59)#19 | 2.4%(+2.22)#4,029 |
| 20. | Falmouth | 4.5% | 2.0%(+2.51)#20 | 2.4%(+2.14)#4,154 |
| 21. | Weweantic | 4.4% | 2.0%(+2.39)#21 | 2.4%(+2.02)#4,341 |
| 22. | East Douglas | 4.4% | 2.0%(+2.39)#22 | 2.4%(+2.01)#4,355 |
| 23. | Agawam Town | 4.4% | 2.0%(+2.37)#23 | 2.4%(+1.99)#4,376 |
| 24. | Franklin Town | 4.3% | 2.0%(+2.30)#24 | 2.4%(+1.93)#4,514 |
| 25. | The Pinehills | 4.3% | 2.0%(+2.29)#25 | 2.4%(+1.92)#4,533 |
| 26. | Hopedale | 4.2% | 2.0%(+2.16)#26 | 2.4%(+1.78)#4,784 |
| 27. | Green Harbor | 4.1% | 2.0%(+2.11)#27 | 2.4%(+1.74)#4,877 |
| 28. | Buzzards Bay | 4.1% | 2.0%(+2.04)#28 | 2.4%(+1.67)#5,007 |
| 29. | Wilbraham | 4.1% | 2.0%(+2.02)#29 | 2.4%(+1.65)#5,033 |
| 30. | Hatfield | 4.0% | 2.0%(+2.02)#30 | 2.4%(+1.64)#5,051 |
| 31. | Holland | 3.9% | 2.0%(+1.83)#31 | 2.4%(+1.45)#5,475 |
| 32. | Rockport | 3.9% | 2.0%(+1.83)#32 | 2.4%(+1.45)#5,482 |
| 33. | Hanson | 3.8% | 2.0%(+1.76)#33 | 2.4%(+1.39)#5,629 |
| 34. | Medfield | 3.8% | 2.0%(+1.76)#34 | 2.4%(+1.39)#5,634 |
| 35. | Palmer Town | 3.8% | 2.0%(+1.76)#35 | 2.4%(+1.39)#5,636 |
| 36. | Lynnfield | 3.8% | 2.0%(+1.72)#36 | 2.4%(+1.35)#5,727 |
| 37. | Taunton | 3.7% | 2.0%(+1.67)#37 | 2.4%(+1.30)#5,846 |
| 38. | Monson Center | 3.6% | 2.0%(+1.53)#38 | 2.4%(+1.16)#6,169 |
| 39. | New Bedford | 3.5% | 2.0%(+1.52)#39 | 2.4%(+1.14)#6,213 |
| 40. | Stoneham | 3.5% | 2.0%(+1.50)#40 | 2.4%(+1.13)#6,251 |
| 41. | Amesbury Town | 3.4% | 2.0%(+1.39)#41 | 2.4%(+1.01)#6,593 |
| 42. | Westborough | 3.4% | 2.0%(+1.38)#42 | 2.4%(+1.00)#6,621 |
| 43. | Fiskdale | 3.4% | 2.0%(+1.36)#43 | 2.4%(+0.988)#6,681 |
| 44. | North Seekonk | 3.3% | 2.0%(+1.29)#44 | 2.4%(+0.913)#6,945 |
| 45. | East Dennis | 3.3% | 2.0%(+1.28)#45 | 2.4%(+0.902)#6,983 |
| 46. | Russell | 3.2% | 2.0%(+1.15)#46 | 2.4%(+0.779)#7,349 |
| 47. | Huntington | 3.2% | 2.0%(+1.14)#47 | 2.4%(+0.766)#7,384 |
| 48. | Hingham | 3.1% | 2.0%(+1.09)#48 | 2.4%(+0.712)#7,551 |
| 49. | Devens | 3.1% | 2.0%(+1.07)#49 | 2.4%(+0.698)#7,600 |
| 50. | Sandwich | 3.1% | 2.0%(+1.06)#50 | 2.4%(+0.685)#7,647 |
| 51. | Hull | 3.1% | 2.0%(+1.03)#51 | 2.4%(+0.653)#7,769 |
| 52. | Somerset | 3.0% | 2.0%(+1.01)#52 | 2.4%(+0.631)#7,841 |
| 53. | Boxford | 3.0% | 2.0%(+0.969)#53 | 2.4%(+0.595)#7,974 |
| 54. | South Yarmouth | 2.9% | 2.0%(+0.922)#54 | 2.4%(+0.548)#8,146 |
| 55. | Attleboro | 2.9% | 2.0%(+0.915)#55 | 2.4%(+0.541)#8,165 |
| 56. | Longmeadow | 2.9% | 2.0%(+0.907)#56 | 2.4%(+0.533)#8,209 |
| 57. | Cochituate | 2.9% | 2.0%(+0.850)#57 | 2.4%(+0.476)#8,416 |
| 58. | Marion Center | 2.8% | 2.0%(+0.808)#58 | 2.4%(+0.434)#8,594 |
| 59. | Wareham Center | 2.8% | 2.0%(+0.793)#59 | 2.4%(+0.419)#8,648 |
| 60. | Holyoke | 2.8% | 2.0%(+0.776)#60 | 2.4%(+0.402)#8,724 |
| 61. | Dennis | 2.8% | 2.0%(+0.764)#61 | 2.4%(+0.390)#8,770 |
| 62. | East Sandwich | 2.7% | 2.0%(+0.709)#62 | 2.4%(+0.335)#9,006 |
| 63. | Seabrook | 2.7% | 2.0%(+0.705)#63 | 2.4%(+0.331)#9,024 |
| 64. | Westfield | 2.7% | 2.0%(+0.697)#64 | 2.4%(+0.323)#9,048 |
| 65. | Northborough | 2.7% | 2.0%(+0.626)#65 | 2.4%(+0.252)#9,349 |
| 66. | South Duxbury | 2.6% | 2.0%(+0.617)#66 | 2.4%(+0.243)#9,393 |
| 67. | Peabody | 2.6% | 2.0%(+0.599)#67 | 2.4%(+0.225)#9,465 |
| 68. | Chicopee | 2.6% | 2.0%(+0.598)#68 | 2.4%(+0.224)#9,469 |
| 69. | Granby | 2.6% | 2.0%(+0.565)#69 | 2.4%(+0.191)#9,622 |
| 70. | Weymouth Town | 2.6% | 2.0%(+0.563)#70 | 2.4%(+0.189)#9,624 |
| 71. | Wakefield | 2.6% | 2.0%(+0.563)#71 | 2.4%(+0.189)#9,628 |
| 72. | North Pembroke | 2.6% | 2.0%(+0.561)#72 | 2.4%(+0.187)#9,639 |
| 73. | Springfield | 2.6% | 2.0%(+0.533)#73 | 2.4%(+0.159)#9,754 |
| 74. | Methuen Town | 2.5% | 2.0%(+0.470)#74 | 2.4%(+0.096)#10,040 |
| 75. | Leominster | 2.5% | 2.0%(+0.459)#75 | 2.4%(+0.085)#10,074 |
| 76. | Gloucester | 2.5% | 2.0%(+0.458)#76 | 2.4%(+0.084)#10,083 |
| 77. | Fall River | 2.5% | 2.0%(+0.444)#77 | 2.4%(+0.070)#10,139 |
| 78. | Pittsfield | 2.4% | 2.0%(+0.421)#78 | 2.4%(+0.047)#10,230 |
| 79. | Wilmington | 2.4% | 2.0%(+0.414)#79 | 2.4%(+0.040)#10,253 |
| 80. | Milford | 2.4% | 2.0%(+0.402)#80 | 2.4%(+0.029)#10,314 |
| 81. | Brockton | 2.4% | 2.0%(+0.389)#81 | 2.4%(+0.015)#10,366 |
| 82. | Southbridge Town | 2.4% | 2.0%(+0.388)#82 | 2.4%(+0.015)#10,368 |
| 83. | Bellingham | 2.4% | 2.0%(+0.387)#83 | 2.4%(+0.013)#10,372 |
| 84. | Barnstable Town | 2.4% | 2.0%(+0.373)#84 | 2.4%(-0.001)#10,457 |
| 85. | Webster | 2.4% | 2.0%(+0.372)#85 | 2.4%(-0.002)#10,468 |
| 86. | Milton | 2.4% | 2.0%(+0.367)#86 | 2.4%(-0.007)#10,486 |
| 87. | Hopkinton | 2.4% | 2.0%(+0.331)#87 | 2.4%(-0.043)#10,653 |
| 88. | Saugus | 2.3% | 2.0%(+0.297)#88 | 2.4%(-0.077)#10,802 |
| 89. | Easthampton Town | 2.3% | 2.0%(+0.297)#89 | 2.4%(-0.077)#10,803 |
| 90. | Needham | 2.3% | 2.0%(+0.286)#90 | 2.4%(-0.088)#10,848 |
| 91. | Danvers | 2.3% | 2.0%(+0.261)#91 | 2.4%(-0.112)#10,946 |
| 92. | Mansfield Center | 2.3% | 2.0%(+0.248)#92 | 2.4%(-0.125)#11,002 |
| 93. | West Concord | 2.3% | 2.0%(+0.232)#93 | 2.4%(-0.142)#11,083 |
| 94. | Worcester | 2.2% | 2.0%(+0.195)#94 | 2.4%(-0.179)#11,235 |
| 95. | Littleton Common | 2.2% | 2.0%(+0.180)#95 | 2.4%(-0.194)#11,330 |
| 96. | Forestdale | 2.2% | 2.0%(+0.173)#96 | 2.4%(-0.200)#11,369 |
| 97. | Provincetown | 2.2% | 2.0%(+0.161)#97 | 2.4%(-0.213)#11,444 |
| 98. | Marlborough | 2.2% | 2.0%(+0.157)#98 | 2.4%(-0.217)#11,460 |
| 99. | West Dennis | 2.2% | 2.0%(+0.157)#99 | 2.4%(-0.217)#11,461 |
| 100. | Swampscott | 2.1% | 2.0%(+0.105)#100 | 2.4%(-0.269)#11,706 |
Common Questions
What are the Top 10 Cities with the Highest Percentage of Population Employed in Wholesale Trade in Massachusetts?
Top 10 Cities with the Highest Percentage of Population Employed in Wholesale Trade in Massachusetts are:
#1
31.2%
#2
25.6%
#3
16.2%
#4
9.5%
#5
8.7%
#6
8.6%
#7
7.3%
#8
6.5%
#9
6.4%
#10
6.3%
What city has the Highest Percentage of Population Employed in Wholesale Trade in Massachusetts?
Warren has the Highest Percentage of Population Employed in Wholesale Trade in Massachusetts with 31.2%.
What is the Percentage of Population Employed in Wholesale Trade in the State of Massachusetts?
Percentage of Population Employed in Wholesale Trade in Massachusetts is 2.0%.
What is the Percentage of Population Employed in Wholesale Trade in the United States?
Percentage of Population Employed in Wholesale Trade in the United States is 2.4%.