Cities with the Highest Percentage of Population Employed in Wholesale Trade in Illinois
RELATED REPORTS & OPTIONS
Wholesale Trade
Illinois
Compare Cities
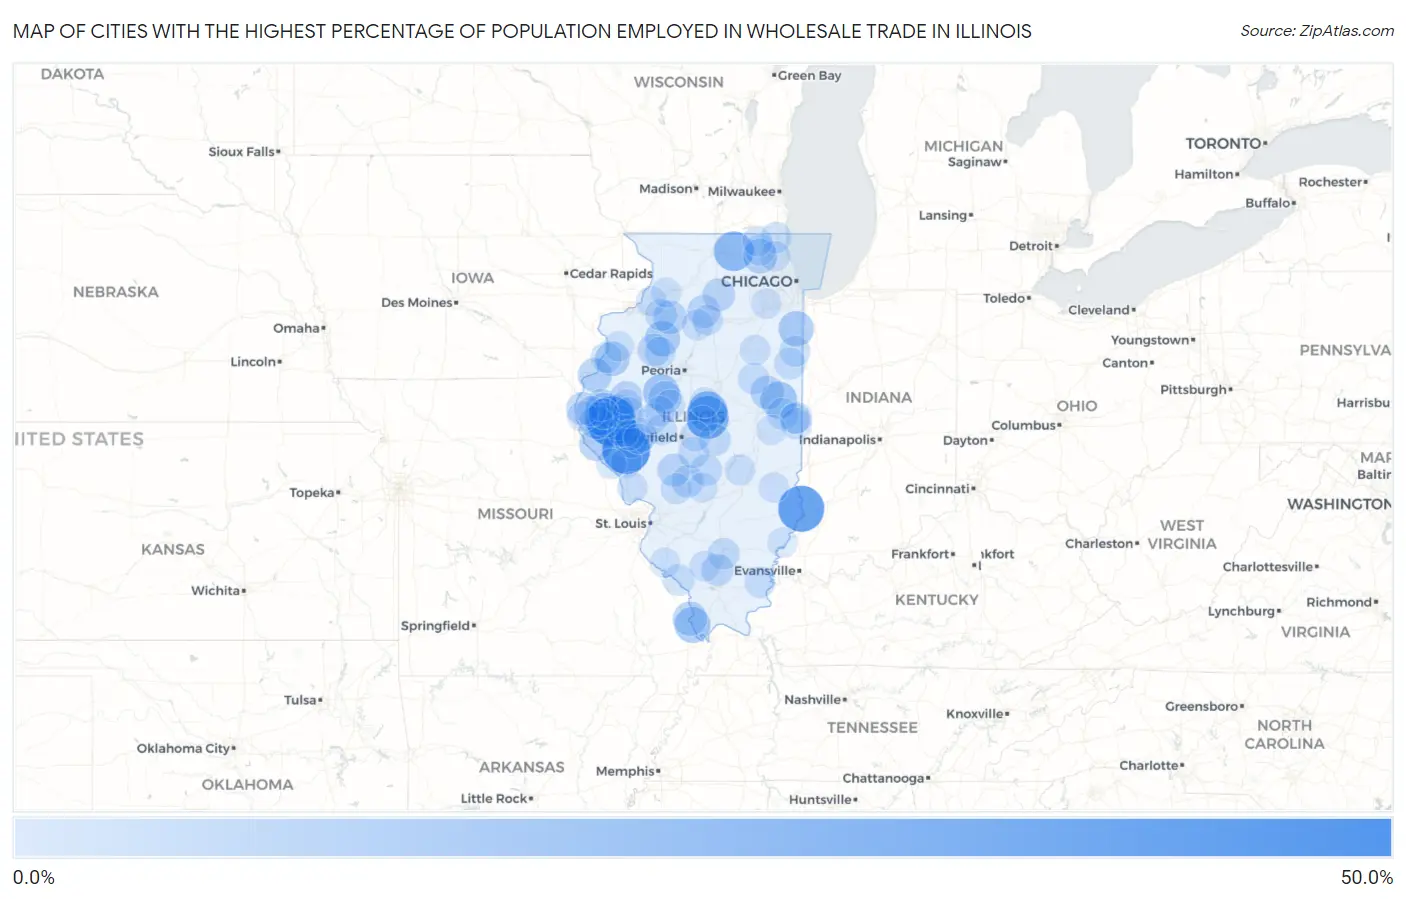
Map of Cities with the Highest Percentage of Population Employed in Wholesale Trade in Illinois
0.0%
50.0%
Cities with the Highest Percentage of Population Employed in Wholesale Trade in Illinois
| City | % Employed | vs State | vs National | |
| 1. | Mound Station | 43.2% | 2.8%(+40.5)#1 | 2.4%(+40.8)#43 |
| 2. | Merritt | 41.2% | 2.8%(+38.4)#2 | 2.4%(+38.8)#49 |
| 3. | Florence | 40.0% | 2.8%(+37.2)#3 | 2.4%(+37.6)#54 |
| 4. | Russellville | 36.6% | 2.8%(+33.8)#4 | 2.4%(+34.2)#64 |
| 5. | Adams | 35.9% | 2.8%(+33.1)#5 | 2.4%(+33.5)#70 |
| 6. | Preemption | 30.6% | 2.8%(+27.9)#6 | 2.4%(+28.2)#102 |
| 7. | Chestnut | 30.0% | 2.8%(+27.2)#7 | 2.4%(+27.6)#105 |
| 8. | Beason | 25.0% | 2.8%(+22.2)#8 | 2.4%(+22.6)#144 |
| 9. | Garden Prairie | 24.7% | 2.8%(+21.9)#9 | 2.4%(+22.3)#157 |
| 10. | Penfield | 19.2% | 2.8%(+16.4)#10 | 2.4%(+16.8)#243 |
| 11. | La Prairie | 18.8% | 2.8%(+16.0)#11 | 2.4%(+16.3)#254 |
| 12. | Liverpool | 18.6% | 2.8%(+15.8)#12 | 2.4%(+16.2)#258 |
| 13. | Thebes | 17.8% | 2.8%(+15.0)#13 | 2.4%(+15.4)#298 |
| 14. | Mount Sterling | 17.5% | 2.8%(+14.7)#14 | 2.4%(+15.1)#317 |
| 15. | Solon Mills | 17.3% | 2.8%(+14.6)#15 | 2.4%(+14.9)#324 |
| 16. | Grant Park | 16.8% | 2.8%(+14.0)#16 | 2.4%(+14.4)#338 |
| 17. | La Fayette | 16.4% | 2.8%(+13.6)#17 | 2.4%(+14.0)#359 |
| 18. | Clayton | 16.1% | 2.8%(+13.3)#18 | 2.4%(+13.7)#368 |
| 19. | Mossville | 15.0% | 2.8%(+12.2)#19 | 2.4%(+12.6)#418 |
| 20. | Biggsville | 14.9% | 2.8%(+12.1)#20 | 2.4%(+12.5)#426 |
| 21. | Trout Valley | 14.8% | 2.8%(+12.0)#21 | 2.4%(+12.4)#433 |
| 22. | East Cape Girardeau | 14.7% | 2.8%(+11.9)#22 | 2.4%(+12.3)#445 |
| 23. | Dallas City | 14.6% | 2.8%(+11.8)#23 | 2.4%(+12.2)#451 |
| 24. | Kinderhook | 14.5% | 2.8%(+11.7)#24 | 2.4%(+12.1)#456 |
| 25. | Camp Point | 13.7% | 2.8%(+10.9)#25 | 2.4%(+11.3)#511 |
| 26. | Concord | 13.6% | 2.8%(+10.8)#26 | 2.4%(+11.2)#515 |
| 27. | Mineral | 13.5% | 2.8%(+10.8)#27 | 2.4%(+11.1)#519 |
| 28. | Ludlow | 13.4% | 2.8%(+10.6)#28 | 2.4%(+11.0)#537 |
| 29. | Arbury Hills | 13.4% | 2.8%(+10.6)#29 | 2.4%(+11.0)#538 |
| 30. | Burtons Bridge | 13.3% | 2.8%(+10.5)#30 | 2.4%(+10.9)#555 |
| 31. | Camden | 13.0% | 2.8%(+10.3)#31 | 2.4%(+10.6)#568 |
| 32. | Columbus | 13.0% | 2.8%(+10.2)#32 | 2.4%(+10.6)#575 |
| 33. | Bluffs | 12.7% | 2.8%(+9.92)#33 | 2.4%(+10.3)#592 |
| 34. | Topeka | 12.5% | 2.8%(+9.71)#34 | 2.4%(+10.1)#625 |
| 35. | Arlington | 12.3% | 2.8%(+9.56)#35 | 2.4%(+9.94)#637 |
| 36. | Lima | 12.2% | 2.8%(+9.40)#36 | 2.4%(+9.79)#650 |
| 37. | Industry | 12.1% | 2.8%(+9.32)#37 | 2.4%(+9.71)#662 |
| 38. | Paw Paw | 12.1% | 2.8%(+9.28)#38 | 2.4%(+9.67)#666 |
| 39. | Standard City | 11.9% | 2.8%(+9.15)#39 | 2.4%(+9.54)#677 |
| 40. | Oak Run | 11.6% | 2.8%(+8.77)#40 | 2.4%(+9.16)#720 |
| 41. | Butler | 11.0% | 2.8%(+8.20)#41 | 2.4%(+8.59)#788 |
| 42. | Bowen | 11.0% | 2.8%(+8.19)#42 | 2.4%(+8.57)#790 |
| 43. | Versailles | 11.0% | 2.8%(+8.18)#43 | 2.4%(+8.57)#791 |
| 44. | Westlake | 10.8% | 2.8%(+7.98)#44 | 2.4%(+8.36)#820 |
| 45. | Buckner | 10.7% | 2.8%(+7.95)#45 | 2.4%(+8.34)#824 |
| 46. | Bonnie Brae | 10.7% | 2.8%(+7.95)#46 | 2.4%(+8.34)#826 |
| 47. | Boody | 10.4% | 2.8%(+7.66)#47 | 2.4%(+8.05)#870 |
| 48. | Atkinson | 10.4% | 2.8%(+7.59)#48 | 2.4%(+7.98)#877 |
| 49. | Ohlman | 10.3% | 2.8%(+7.55)#49 | 2.4%(+7.94)#882 |
| 50. | Bonnie | 10.1% | 2.8%(+7.35)#50 | 2.4%(+7.74)#913 |
| 51. | Rockwood | 10.0% | 2.8%(+7.21)#51 | 2.4%(+7.60)#949 |
| 52. | Fithian | 9.9% | 2.8%(+7.12)#52 | 2.4%(+7.51)#963 |
| 53. | Littleton | 9.8% | 2.8%(+7.05)#53 | 2.4%(+7.43)#981 |
| 54. | Watseka | 9.8% | 2.8%(+6.99)#54 | 2.4%(+7.37)#994 |
| 55. | Sibley | 9.6% | 2.8%(+6.85)#55 | 2.4%(+7.24)#1,023 |
| 56. | Kincaid | 9.6% | 2.8%(+6.84)#56 | 2.4%(+7.23)#1,024 |
| 57. | Belgium | 9.6% | 2.8%(+6.84)#57 | 2.4%(+7.23)#1,025 |
| 58. | Old Mill Creek | 9.4% | 2.8%(+6.64)#58 | 2.4%(+7.03)#1,066 |
| 59. | Williamsfield | 9.4% | 2.8%(+6.58)#59 | 2.4%(+6.97)#1,077 |
| 60. | Prairie Grove | 9.2% | 2.8%(+6.44)#60 | 2.4%(+6.83)#1,109 |
| 61. | Beaverville | 9.2% | 2.8%(+6.42)#61 | 2.4%(+6.81)#1,113 |
| 62. | Rushville | 9.1% | 2.8%(+6.29)#62 | 2.4%(+6.68)#1,153 |
| 63. | Georgetown | 9.0% | 2.8%(+6.26)#63 | 2.4%(+6.65)#1,155 |
| 64. | Ridgway | 9.0% | 2.8%(+6.25)#64 | 2.4%(+6.64)#1,158 |
| 65. | Lake Ka Ho | 9.0% | 2.8%(+6.20)#65 | 2.4%(+6.59)#1,171 |
| 66. | Gladstone | 9.0% | 2.8%(+6.18)#66 | 2.4%(+6.57)#1,175 |
| 67. | Bureau Junction | 8.9% | 2.8%(+6.11)#67 | 2.4%(+6.50)#1,190 |
| 68. | Dalzell | 8.9% | 2.8%(+6.08)#68 | 2.4%(+6.47)#1,198 |
| 69. | Mount Pulaski | 8.9% | 2.8%(+6.08)#69 | 2.4%(+6.46)#1,199 |
| 70. | Pearl | 8.8% | 2.8%(+6.03)#70 | 2.4%(+6.42)#1,210 |
| 71. | Westville | 8.8% | 2.8%(+6.02)#71 | 2.4%(+6.41)#1,213 |
| 72. | Atlanta | 8.8% | 2.8%(+6.02)#72 | 2.4%(+6.41)#1,214 |
| 73. | Strasburg | 8.7% | 2.8%(+5.96)#73 | 2.4%(+6.35)#1,231 |
| 74. | Ashland | 8.7% | 2.8%(+5.92)#74 | 2.4%(+6.31)#1,239 |
| 75. | St Johns | 8.6% | 2.8%(+5.85)#75 | 2.4%(+6.24)#1,267 |
| 76. | Lowpoint | 8.3% | 2.8%(+5.54)#76 | 2.4%(+5.93)#1,355 |
| 77. | Emington | 8.3% | 2.8%(+5.54)#77 | 2.4%(+5.93)#1,358 |
| 78. | Long Grove | 8.3% | 2.8%(+5.53)#78 | 2.4%(+5.92)#1,371 |
| 79. | Meredosia | 8.3% | 2.8%(+5.52)#79 | 2.4%(+5.91)#1,375 |
| 80. | Chandlerville | 8.3% | 2.8%(+5.51)#80 | 2.4%(+5.90)#1,378 |
| 81. | Mechanicsburg | 8.3% | 2.8%(+5.49)#81 | 2.4%(+5.87)#1,385 |
| 82. | Easton | 8.2% | 2.8%(+5.46)#82 | 2.4%(+5.85)#1,391 |
| 83. | Ursa | 8.1% | 2.8%(+5.35)#83 | 2.4%(+5.74)#1,422 |
| 84. | Kilbourne | 8.1% | 2.8%(+5.32)#84 | 2.4%(+5.71)#1,432 |
| 85. | Edgington | 8.0% | 2.8%(+5.23)#85 | 2.4%(+5.62)#1,453 |
| 86. | Loraine | 8.0% | 2.8%(+5.21)#86 | 2.4%(+5.60)#1,459 |
| 87. | Golden | 8.0% | 2.8%(+5.18)#87 | 2.4%(+5.57)#1,475 |
| 88. | Yale | 7.9% | 2.8%(+5.10)#88 | 2.4%(+5.49)#1,498 |
| 89. | Pleasant Hill | 7.8% | 2.8%(+5.03)#89 | 2.4%(+5.42)#1,527 |
| 90. | Hillsdale | 7.8% | 2.8%(+5.00)#90 | 2.4%(+5.39)#1,540 |
| 91. | Fieldon | 7.8% | 2.8%(+4.99)#91 | 2.4%(+5.38)#1,542 |
| 92. | Crystal Lawns | 7.8% | 2.8%(+4.99)#92 | 2.4%(+5.38)#1,543 |
| 93. | Little York | 7.7% | 2.8%(+4.94)#93 | 2.4%(+5.33)#1,556 |
| 94. | Ringwood | 7.7% | 2.8%(+4.94)#94 | 2.4%(+5.33)#1,557 |
| 95. | Chapin | 7.6% | 2.8%(+4.76)#95 | 2.4%(+5.15)#1,623 |
| 96. | Lyndon | 7.5% | 2.8%(+4.75)#96 | 2.4%(+5.14)#1,629 |
| 97. | Keensburg | 7.5% | 2.8%(+4.71)#97 | 2.4%(+5.10)#1,646 |
| 98. | Evansville | 7.4% | 2.8%(+4.65)#98 | 2.4%(+5.04)#1,655 |
| 99. | Longview | 7.4% | 2.8%(+4.62)#99 | 2.4%(+5.01)#1,679 |
| 100. | Fillmore | 7.4% | 2.8%(+4.59)#100 | 2.4%(+4.98)#1,690 |
Common Questions
What are the Top 10 Cities with the Highest Percentage of Population Employed in Wholesale Trade in Illinois?
Top 10 Cities with the Highest Percentage of Population Employed in Wholesale Trade in Illinois are:
#1
43.2%
#2
40.0%
#3
36.6%
#4
30.0%
#5
25.0%
#6
24.7%
#7
19.2%
#8
18.8%
#9
18.6%
#10
17.8%
What city has the Highest Percentage of Population Employed in Wholesale Trade in Illinois?
Mound Station has the Highest Percentage of Population Employed in Wholesale Trade in Illinois with 43.2%.
What is the Percentage of Population Employed in Wholesale Trade in the State of Illinois?
Percentage of Population Employed in Wholesale Trade in Illinois is 2.8%.
What is the Percentage of Population Employed in Wholesale Trade in the United States?
Percentage of Population Employed in Wholesale Trade in the United States is 2.4%.