Cities with the Highest Percentage of Population Employed in Wholesale Trade in Ohio
RELATED REPORTS & OPTIONS
Wholesale Trade
Ohio
Compare Cities
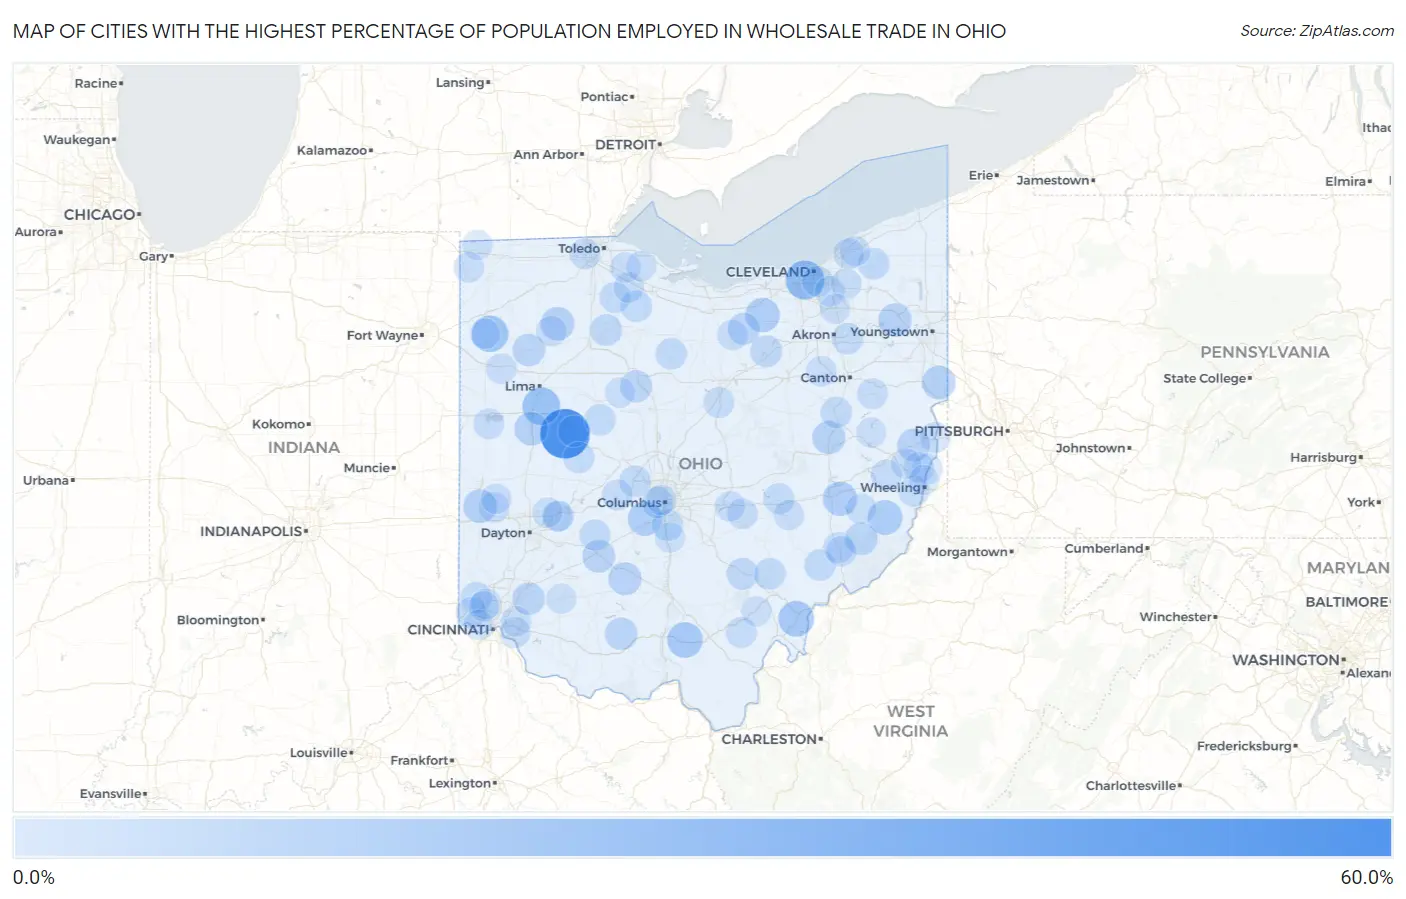
Map of Cities with the Highest Percentage of Population Employed in Wholesale Trade in Ohio
0.0%
60.0%
Cities with the Highest Percentage of Population Employed in Wholesale Trade in Ohio
| City | % Employed | vs State | vs National | |
| 1. | Lewistown | 52.0% | 2.4%(+49.6)#1 | 2.4%(+49.6)#33 |
| 2. | Linndale | 25.4% | 2.4%(+22.9)#2 | 2.4%(+23.0)#139 |
| 3. | Uniopolis | 22.8% | 2.4%(+20.4)#3 | 2.4%(+20.4)#177 |
| 4. | Broughton | 20.0% | 2.4%(+17.6)#4 | 2.4%(+17.6)#228 |
| 5. | Tuppers Plains | 18.2% | 2.4%(+15.8)#5 | 2.4%(+15.8)#273 |
| 6. | Beaver | 17.8% | 2.4%(+15.3)#6 | 2.4%(+15.4)#300 |
| 7. | Wilson | 15.9% | 2.4%(+13.5)#7 | 2.4%(+13.5)#373 |
| 8. | Pheasant Run | 15.0% | 2.4%(+12.5)#8 | 2.4%(+12.6)#421 |
| 9. | Darbydale | 14.7% | 2.4%(+12.3)#9 | 2.4%(+12.3)#444 |
| 10. | Lore City | 14.6% | 2.4%(+12.2)#10 | 2.4%(+12.2)#452 |
| 11. | Botkins | 13.4% | 2.4%(+11.0)#11 | 2.4%(+11.0)#531 |
| 12. | Lake Tomahawk | 13.4% | 2.4%(+11.0)#12 | 2.4%(+11.0)#534 |
| 13. | Castine | 13.3% | 2.4%(+10.9)#13 | 2.4%(+10.9)#545 |
| 14. | Belmore | 13.2% | 2.4%(+10.7)#14 | 2.4%(+10.8)#558 |
| 15. | South Canal | 12.6% | 2.4%(+10.2)#15 | 2.4%(+10.2)#598 |
| 16. | Stone Creek | 12.2% | 2.4%(+9.74)#16 | 2.4%(+9.76)#655 |
| 17. | Good Hope | 11.8% | 2.4%(+9.34)#17 | 2.4%(+9.36)#697 |
| 18. | Bloomingdale | 11.6% | 2.4%(+9.20)#18 | 2.4%(+9.23)#711 |
| 19. | Milledgeville | 11.5% | 2.4%(+9.11)#19 | 2.4%(+9.14)#725 |
| 20. | Sinking Spring | 11.1% | 2.4%(+8.68)#20 | 2.4%(+8.71)#763 |
| 21. | Kalida | 11.0% | 2.4%(+8.58)#21 | 2.4%(+8.60)#786 |
| 22. | Oakwood Village Cuyahoga County | 10.9% | 2.4%(+8.51)#22 | 2.4%(+8.54)#796 |
| 23. | Stafford | 10.7% | 2.4%(+8.29)#23 | 2.4%(+8.31)#830 |
| 24. | Maineville | 10.6% | 2.4%(+8.13)#24 | 2.4%(+8.15)#850 |
| 25. | Rochester | 9.9% | 2.4%(+7.43)#25 | 2.4%(+7.46)#972 |
| 26. | Harpster | 9.8% | 2.4%(+7.33)#26 | 2.4%(+7.35)#998 |
| 27. | West Salem | 9.4% | 2.4%(+6.98)#27 | 2.4%(+7.00)#1,073 |
| 28. | Haydenville | 9.3% | 2.4%(+6.92)#28 | 2.4%(+6.94)#1,085 |
| 29. | Arcadia | 8.9% | 2.4%(+6.52)#29 | 2.4%(+6.54)#1,180 |
| 30. | Burgoon | 8.9% | 2.4%(+6.50)#30 | 2.4%(+6.53)#1,185 |
| 31. | Waterford | 8.8% | 2.4%(+6.42)#31 | 2.4%(+6.45)#1,206 |
| 32. | Huntsville | 8.6% | 2.4%(+6.14)#32 | 2.4%(+6.17)#1,286 |
| 33. | Jacksonville | 8.6% | 2.4%(+6.13)#33 | 2.4%(+6.15)#1,295 |
| 34. | Plain City | 8.4% | 2.4%(+5.94)#34 | 2.4%(+5.96)#1,340 |
| 35. | Aquilla | 8.3% | 2.4%(+5.91)#35 | 2.4%(+5.93)#1,349 |
| 36. | Lockbourne | 8.3% | 2.4%(+5.91)#36 | 2.4%(+5.93)#1,350 |
| 37. | Parral | 8.3% | 2.4%(+5.91)#37 | 2.4%(+5.93)#1,351 |
| 38. | Valleyview | 8.3% | 2.4%(+5.88)#38 | 2.4%(+5.91)#1,377 |
| 39. | Chatfield | 8.2% | 2.4%(+5.77)#39 | 2.4%(+5.80)#1,408 |
| 40. | West Liberty | 8.0% | 2.4%(+5.54)#40 | 2.4%(+5.56)#1,477 |
| 41. | Ridgeway | 7.9% | 2.4%(+5.52)#41 | 2.4%(+5.55)#1,480 |
| 42. | Mogadore | 7.8% | 2.4%(+5.41)#42 | 2.4%(+5.44)#1,518 |
| 43. | Bradner | 7.5% | 2.4%(+5.12)#43 | 2.4%(+5.14)#1,627 |
| 44. | South Solon | 7.5% | 2.4%(+5.09)#44 | 2.4%(+5.11)#1,637 |
| 45. | North Zanesville | 7.5% | 2.4%(+5.07)#45 | 2.4%(+5.10)#1,643 |
| 46. | Ross | 7.4% | 2.4%(+5.00)#46 | 2.4%(+5.03)#1,659 |
| 47. | Malvern | 7.3% | 2.4%(+4.82)#47 | 2.4%(+4.85)#1,740 |
| 48. | Flushing | 7.2% | 2.4%(+4.81)#48 | 2.4%(+4.84)#1,746 |
| 49. | Miamitown | 7.1% | 2.4%(+4.72)#49 | 2.4%(+4.74)#1,794 |
| 50. | Neffs | 7.1% | 2.4%(+4.69)#50 | 2.4%(+4.71)#1,824 |
| 51. | Plumwood | 7.1% | 2.4%(+4.67)#51 | 2.4%(+4.70)#1,831 |
| 52. | Wilkesville | 7.0% | 2.4%(+4.59)#52 | 2.4%(+4.62)#1,876 |
| 53. | Dexter City | 7.0% | 2.4%(+4.59)#53 | 2.4%(+4.62)#1,880 |
| 54. | Cuyahoga Heights | 7.0% | 2.4%(+4.55)#54 | 2.4%(+4.58)#1,896 |
| 55. | Bellville | 7.0% | 2.4%(+4.53)#55 | 2.4%(+4.56)#1,900 |
| 56. | Glenford | 6.9% | 2.4%(+4.45)#56 | 2.4%(+4.47)#1,954 |
| 57. | Enon | 6.9% | 2.4%(+4.43)#57 | 2.4%(+4.46)#1,962 |
| 58. | Montezuma | 6.8% | 2.4%(+4.39)#58 | 2.4%(+4.42)#1,988 |
| 59. | Cherry Grove | 6.8% | 2.4%(+4.37)#59 | 2.4%(+4.39)#2,002 |
| 60. | Holland | 6.7% | 2.4%(+4.27)#60 | 2.4%(+4.29)#2,051 |
| 61. | Waite Hill | 6.7% | 2.4%(+4.24)#61 | 2.4%(+4.27)#2,060 |
| 62. | Rayland | 6.5% | 2.4%(+4.11)#62 | 2.4%(+4.13)#2,136 |
| 63. | Gibsonburg | 6.5% | 2.4%(+4.07)#63 | 2.4%(+4.10)#2,156 |
| 64. | Pottery Addition | 6.5% | 2.4%(+4.07)#64 | 2.4%(+4.09)#2,159 |
| 65. | Gordon | 6.5% | 2.4%(+4.02)#65 | 2.4%(+4.05)#2,182 |
| 66. | New London | 6.4% | 2.4%(+3.99)#66 | 2.4%(+4.02)#2,207 |
| 67. | Macksburg | 6.2% | 2.4%(+3.82)#67 | 2.4%(+3.85)#2,323 |
| 68. | Dillonvale | 6.2% | 2.4%(+3.80)#68 | 2.4%(+3.82)#2,341 |
| 69. | Pitsburg | 6.2% | 2.4%(+3.78)#69 | 2.4%(+3.81)#2,356 |
| 70. | North Lawrence | 6.2% | 2.4%(+3.76)#70 | 2.4%(+3.78)#2,370 |
| 71. | Middle Point | 6.1% | 2.4%(+3.71)#71 | 2.4%(+3.73)#2,403 |
| 72. | Mount Healthy Heights | 6.1% | 2.4%(+3.65)#72 | 2.4%(+3.68)#2,443 |
| 73. | West Leipsic | 6.1% | 2.4%(+3.63)#73 | 2.4%(+3.66)#2,451 |
| 74. | Covedale | 6.0% | 2.4%(+3.60)#74 | 2.4%(+3.63)#2,474 |
| 75. | Duncan Falls | 6.0% | 2.4%(+3.58)#75 | 2.4%(+3.61)#2,491 |
| 76. | Blakeslee | 6.0% | 2.4%(+3.57)#76 | 2.4%(+3.60)#2,501 |
| 77. | Adena | 6.0% | 2.4%(+3.56)#77 | 2.4%(+3.59)#2,506 |
| 78. | Pekin | 5.9% | 2.4%(+3.52)#78 | 2.4%(+3.54)#2,540 |
| 79. | Harbor Hills | 5.9% | 2.4%(+3.52)#79 | 2.4%(+3.54)#2,542 |
| 80. | Green Meadows | 5.9% | 2.4%(+3.51)#80 | 2.4%(+3.54)#2,544 |
| 81. | Northgate | 5.9% | 2.4%(+3.49)#81 | 2.4%(+3.52)#2,564 |
| 82. | Genoa | 5.9% | 2.4%(+3.49)#82 | 2.4%(+3.51)#2,567 |
| 83. | Woodworth | 5.9% | 2.4%(+3.48)#83 | 2.4%(+3.51)#2,571 |
| 84. | Grandview Heights | 5.9% | 2.4%(+3.48)#84 | 2.4%(+3.51)#2,574 |
| 85. | Bentleyville | 5.9% | 2.4%(+3.46)#85 | 2.4%(+3.48)#2,588 |
| 86. | Batesville | 5.9% | 2.4%(+3.46)#86 | 2.4%(+3.48)#2,600 |
| 87. | Kirtland Hills | 5.8% | 2.4%(+3.40)#87 | 2.4%(+3.43)#2,629 |
| 88. | Rocky Ridge | 5.7% | 2.4%(+3.32)#88 | 2.4%(+3.35)#2,682 |
| 89. | Albany | 5.7% | 2.4%(+3.32)#89 | 2.4%(+3.34)#2,685 |
| 90. | Walton Hills | 5.7% | 2.4%(+3.25)#90 | 2.4%(+3.27)#2,741 |
| 91. | Midland | 5.6% | 2.4%(+3.22)#91 | 2.4%(+3.25)#2,771 |
| 92. | Boston Heights | 5.6% | 2.4%(+3.21)#92 | 2.4%(+3.24)#2,777 |
| 93. | Latty | 5.6% | 2.4%(+3.21)#93 | 2.4%(+3.23)#2,787 |
| 94. | Park Layne | 5.6% | 2.4%(+3.20)#94 | 2.4%(+3.23)#2,793 |
| 95. | Terrace Park | 5.6% | 2.4%(+3.18)#95 | 2.4%(+3.21)#2,815 |
| 96. | Ashville | 5.6% | 2.4%(+3.15)#96 | 2.4%(+3.18)#2,835 |
| 97. | Lake Seneca | 5.6% | 2.4%(+3.13)#97 | 2.4%(+3.15)#2,853 |
| 98. | Marseilles | 5.6% | 2.4%(+3.13)#98 | 2.4%(+3.15)#2,868 |
| 99. | Bowerston | 5.5% | 2.4%(+3.09)#99 | 2.4%(+3.12)#2,894 |
| 100. | Martins Ferry | 5.4% | 2.4%(+3.01)#100 | 2.4%(+3.03)#2,981 |
Common Questions
What are the Top 10 Cities with the Highest Percentage of Population Employed in Wholesale Trade in Ohio?
Top 10 Cities with the Highest Percentage of Population Employed in Wholesale Trade in Ohio are:
#1
52.0%
#2
25.4%
#3
22.8%
#4
20.0%
#5
18.2%
#6
17.8%
#7
15.9%
#8
15.0%
#9
14.7%
#10
14.6%
What city has the Highest Percentage of Population Employed in Wholesale Trade in Ohio?
Lewistown has the Highest Percentage of Population Employed in Wholesale Trade in Ohio with 52.0%.
What is the Percentage of Population Employed in Wholesale Trade in the State of Ohio?
Percentage of Population Employed in Wholesale Trade in Ohio is 2.4%.
What is the Percentage of Population Employed in Wholesale Trade in the United States?
Percentage of Population Employed in Wholesale Trade in the United States is 2.4%.