Cities with the Highest Percentage of Population Employed in Wholesale Trade in Connecticut
RELATED REPORTS & OPTIONS
Wholesale Trade
Connecticut
Compare Cities
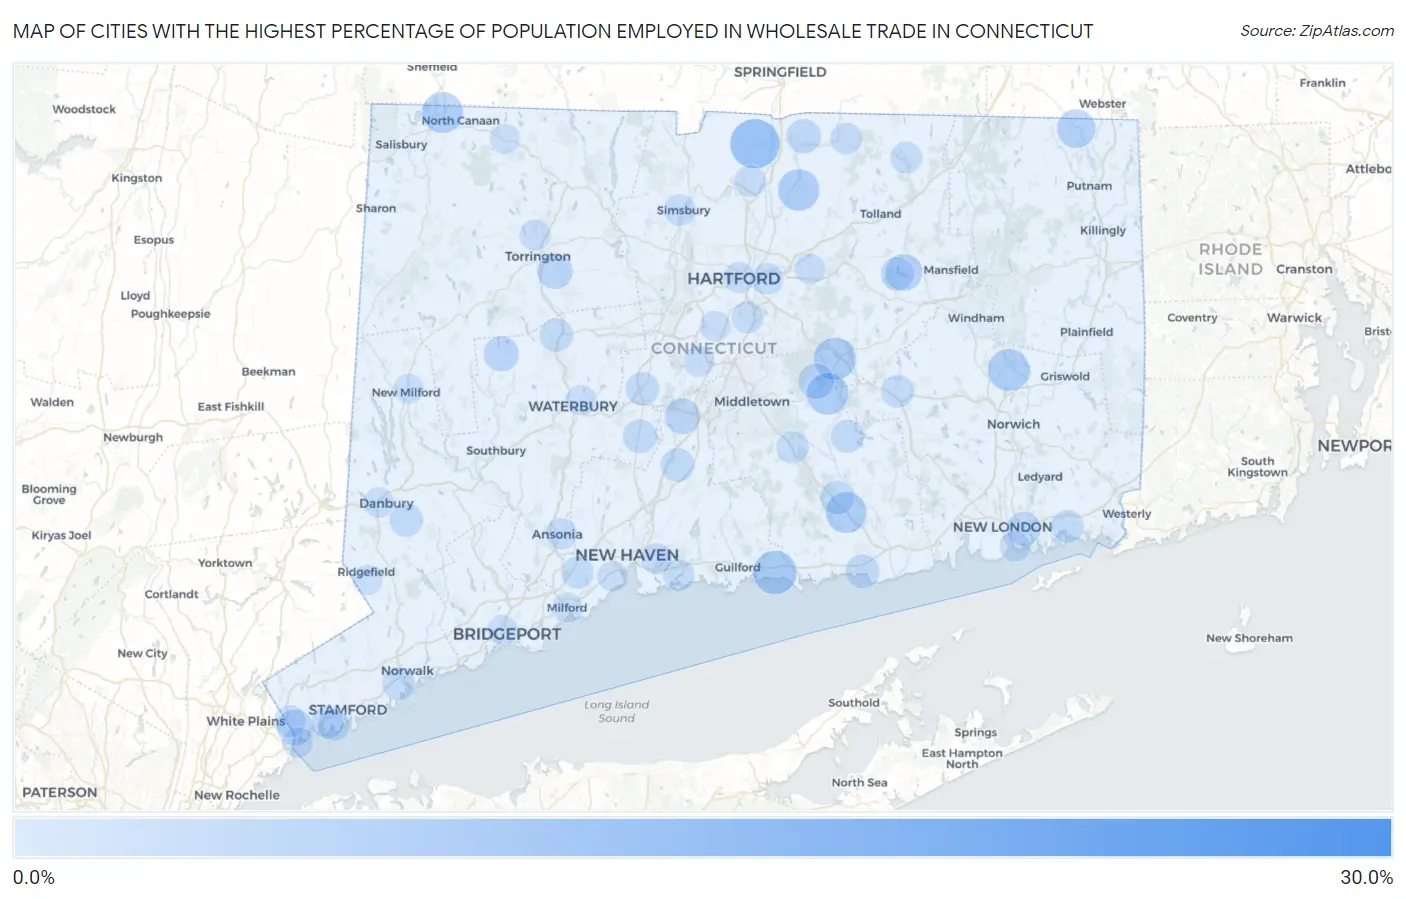
Map of Cities with the Highest Percentage of Population Employed in Wholesale Trade in Connecticut
0.0%
30.0%
Cities with the Highest Percentage of Population Employed in Wholesale Trade in Connecticut
| City | % Employed | vs State | vs National | |
| 1. | Bogus Hill | 26.3% | 2.2%(+24.1)#1 | 2.4%(+23.9)#130 |
| 2. | Dayville | 22.2% | 2.2%(+19.9)#2 | 2.4%(+19.8)#189 |
| 3. | Greens Farms | 20.4% | 2.2%(+18.2)#3 | 2.4%(+18.0)#218 |
| 4. | Sail Harbor | 18.9% | 2.2%(+16.7)#4 | 2.4%(+16.5)#251 |
| 5. | Lake Chaffee | 13.4% | 2.2%(+11.2)#5 | 2.4%(+11.0)#532 |
| 6. | West Cornwall | 11.1% | 2.2%(+8.90)#6 | 2.4%(+8.71)#772 |
| 7. | Suffield Depot | 11.0% | 2.2%(+8.76)#7 | 2.4%(+8.56)#792 |
| 8. | Ridgebury | 9.1% | 2.2%(+6.87)#8 | 2.4%(+6.68)#1,154 |
| 9. | Gaylordsville | 9.0% | 2.2%(+6.74)#9 | 2.4%(+6.55)#1,177 |
| 10. | Madison Center | 8.2% | 2.2%(+5.96)#10 | 2.4%(+5.77)#1,417 |
| 11. | Redding Center | 7.6% | 2.2%(+5.41)#11 | 2.4%(+5.22)#1,597 |
| 12. | Terramuggus | 7.5% | 2.2%(+5.31)#12 | 2.4%(+5.12)#1,635 |
| 13. | Baltic | 7.4% | 2.2%(+5.19)#13 | 2.4%(+5.00)#1,684 |
| 14. | East Hampton | 7.3% | 2.2%(+5.12)#14 | 2.4%(+4.93)#1,712 |
| 15. | Broad Brook | 7.2% | 2.2%(+4.98)#15 | 2.4%(+4.79)#1,773 |
| 16. | Cornwall Bridge | 7.1% | 2.2%(+4.93)#16 | 2.4%(+4.74)#1,805 |
| 17. | Deep River Center | 7.0% | 2.2%(+4.77)#17 | 2.4%(+4.58)#1,891 |
| 18. | Canaan | 7.0% | 2.2%(+4.77)#18 | 2.4%(+4.58)#1,893 |
| 19. | Old Hill | 6.1% | 2.2%(+3.91)#19 | 2.4%(+3.72)#2,407 |
| 20. | Quinebaug | 5.9% | 2.2%(+3.65)#20 | 2.4%(+3.46)#2,614 |
| 21. | Stonington Borough | 5.7% | 2.2%(+3.52)#21 | 2.4%(+3.33)#2,696 |
| 22. | Mill Plain | 5.7% | 2.2%(+3.52)#22 | 2.4%(+3.33)#2,698 |
| 23. | Danielson Borough | 5.6% | 2.2%(+3.42)#23 | 2.4%(+3.23)#2,790 |
| 24. | Candlewood Knolls | 5.6% | 2.2%(+3.34)#24 | 2.4%(+3.15)#2,862 |
| 25. | Bridgewater | 5.6% | 2.2%(+3.34)#25 | 2.4%(+3.15)#2,866 |
| 26. | Route 7 Gateway | 5.5% | 2.2%(+3.28)#26 | 2.4%(+3.09)#2,925 |
| 27. | Lakeside Woods | 5.5% | 2.2%(+3.26)#27 | 2.4%(+3.07)#2,949 |
| 28. | Poplar Plains | 5.3% | 2.2%(+3.07)#28 | 2.4%(+2.88)#3,153 |
| 29. | South Coventry | 5.1% | 2.2%(+2.86)#29 | 2.4%(+2.67)#3,409 |
| 30. | Plattsville | 5.0% | 2.2%(+2.80)#30 | 2.4%(+2.61)#3,478 |
| 31. | Pemberwick | 4.7% | 2.2%(+2.52)#31 | 2.4%(+2.33)#3,842 |
| 32. | Daniels Farm | 4.7% | 2.2%(+2.50)#32 | 2.4%(+2.31)#3,869 |
| 33. | Lake Pocotopaug | 4.6% | 2.2%(+2.34)#33 | 2.4%(+2.15)#4,126 |
| 34. | Meriden | 4.5% | 2.2%(+2.27)#34 | 2.4%(+2.08)#4,232 |
| 35. | Northwest Harwinton | 4.4% | 2.2%(+2.21)#35 | 2.4%(+2.02)#4,343 |
| 36. | Bethlehem Village | 4.3% | 2.2%(+2.10)#36 | 2.4%(+1.91)#4,557 |
| 37. | Murray | 4.3% | 2.2%(+2.08)#37 | 2.4%(+1.89)#4,597 |
| 38. | Stratford Downtown | 4.2% | 2.2%(+2.02)#38 | 2.4%(+1.83)#4,719 |
| 39. | Ball Pond | 4.0% | 2.2%(+1.77)#39 | 2.4%(+1.58)#5,192 |
| 40. | Darien Downtown | 4.0% | 2.2%(+1.75)#40 | 2.4%(+1.56)#5,225 |
| 41. | Hazardville | 3.9% | 2.2%(+1.73)#41 | 2.4%(+1.54)#5,263 |
| 42. | Inglenook | 3.9% | 2.2%(+1.66)#42 | 2.4%(+1.47)#5,433 |
| 43. | Weston | 3.8% | 2.2%(+1.60)#43 | 2.4%(+1.41)#5,584 |
| 44. | Long Hill | 3.8% | 2.2%(+1.57)#44 | 2.4%(+1.38)#5,663 |
| 45. | Northford | 3.8% | 2.2%(+1.55)#45 | 2.4%(+1.36)#5,711 |
| 46. | Saybrook Manor | 3.7% | 2.2%(+1.53)#46 | 2.4%(+1.34)#5,746 |
| 47. | Chester Center | 3.7% | 2.2%(+1.53)#47 | 2.4%(+1.34)#5,760 |
| 48. | Cheshire Village | 3.7% | 2.2%(+1.51)#48 | 2.4%(+1.31)#5,801 |
| 49. | Wallingford Center | 3.6% | 2.2%(+1.41)#49 | 2.4%(+1.22)#6,005 |
| 50. | Bethel | 3.6% | 2.2%(+1.36)#50 | 2.4%(+1.17)#6,115 |
| 51. | Plantsville | 3.5% | 2.2%(+1.33)#51 | 2.4%(+1.14)#6,212 |
| 52. | Stepney | 3.5% | 2.2%(+1.32)#52 | 2.4%(+1.13)#6,239 |
| 53. | Coventry Lake | 3.5% | 2.2%(+1.32)#53 | 2.4%(+1.13)#6,248 |
| 54. | Thomaston | 3.5% | 2.2%(+1.29)#54 | 2.4%(+1.10)#6,340 |
| 55. | Lake Bungee | 3.5% | 2.2%(+1.25)#55 | 2.4%(+1.06)#6,477 |
| 56. | Jewett City Borough | 3.4% | 2.2%(+1.19)#56 | 2.4%(+1.000)#6,629 |
| 57. | Moodus | 3.4% | 2.2%(+1.19)#57 | 2.4%(+0.999)#6,636 |
| 58. | Colchester | 3.3% | 2.2%(+1.10)#58 | 2.4%(+0.906)#6,971 |
| 59. | Bigelow Corners | 3.2% | 2.2%(+1.03)#59 | 2.4%(+0.835)#7,176 |
| 60. | Norwalk | 3.2% | 2.2%(+0.980)#60 | 2.4%(+0.789)#7,319 |
| 61. | Mystic | 3.1% | 2.2%(+0.880)#61 | 2.4%(+0.689)#7,630 |
| 62. | Compo | 3.1% | 2.2%(+0.856)#62 | 2.4%(+0.665)#7,722 |
| 63. | Riverside | 3.0% | 2.2%(+0.830)#63 | 2.4%(+0.640)#7,815 |
| 64. | Higganum | 3.0% | 2.2%(+0.793)#64 | 2.4%(+0.603)#7,937 |
| 65. | Orange | 3.0% | 2.2%(+0.774)#65 | 2.4%(+0.584)#8,014 |
| 66. | Oronoque | 3.0% | 2.2%(+0.749)#66 | 2.4%(+0.559)#8,102 |
| 67. | Indian Field | 3.0% | 2.2%(+0.745)#67 | 2.4%(+0.554)#8,122 |
| 68. | Somers | 2.9% | 2.2%(+0.688)#68 | 2.4%(+0.497)#8,326 |
| 69. | Glenville | 2.9% | 2.2%(+0.664)#69 | 2.4%(+0.474)#8,420 |
| 70. | Old Greenwich | 2.8% | 2.2%(+0.612)#70 | 2.4%(+0.422)#8,638 |
| 71. | Stafford Springs | 2.8% | 2.2%(+0.611)#71 | 2.4%(+0.420)#8,644 |
| 72. | Staples | 2.8% | 2.2%(+0.596)#72 | 2.4%(+0.405)#8,710 |
| 73. | Wethersfield | 2.8% | 2.2%(+0.562)#73 | 2.4%(+0.372)#8,862 |
| 74. | East Hartford | 2.7% | 2.2%(+0.453)#74 | 2.4%(+0.263)#9,308 |
| 75. | Windsor Locks | 2.6% | 2.2%(+0.435)#75 | 2.4%(+0.244)#9,387 |
| 76. | Branford Center | 2.6% | 2.2%(+0.434)#76 | 2.4%(+0.243)#9,396 |
| 77. | Simsbury Center | 2.6% | 2.2%(+0.379)#77 | 2.4%(+0.188)#9,631 |
| 78. | Ansonia | 2.6% | 2.2%(+0.377)#78 | 2.4%(+0.186)#9,642 |
| 79. | Torrington | 2.5% | 2.2%(+0.329)#79 | 2.4%(+0.138)#9,827 |
| 80. | Kensington | 2.5% | 2.2%(+0.303)#80 | 2.4%(+0.113)#9,960 |
| 81. | East Haven | 2.5% | 2.2%(+0.261)#81 | 2.4%(+0.071)#10,136 |
| 82. | Hartford | 2.5% | 2.2%(+0.261)#82 | 2.4%(+0.071)#10,137 |
| 83. | Mechanicsville | 2.5% | 2.2%(+0.258)#83 | 2.4%(+0.068)#10,155 |
| 84. | Lordship | 2.4% | 2.2%(+0.179)#84 | 2.4%(-0.011)#10,503 |
| 85. | Botsford | 2.3% | 2.2%(+0.094)#85 | 2.4%(-0.096)#10,875 |
| 86. | Byram | 2.3% | 2.2%(+0.085)#86 | 2.4%(-0.105)#10,917 |
| 87. | Litchfield Borough | 2.3% | 2.2%(+0.069)#87 | 2.4%(-0.122)#10,983 |
| 88. | Newington | 2.2% | 2.2%(+0.013)#88 | 2.4%(-0.177)#11,233 |
| 89. | Manchester | 2.2% | 2.2%(+0.002)#89 | 2.4%(-0.189)#11,315 |
| 90. | Groton | 2.2% | 2.2%(-0.040)#90 | 2.4%(-0.230)#11,532 |
| 91. | West Haven | 2.2% | 2.2%(-0.049)#91 | 2.4%(-0.239)#11,565 |
| 92. | Danbury | 2.2% | 2.2%(-0.049)#92 | 2.4%(-0.239)#11,570 |
| 93. | Sandy Hook | 2.1% | 2.2%(-0.123)#93 | 2.4%(-0.314)#11,911 |
| 94. | Bridgeport | 2.1% | 2.2%(-0.132)#94 | 2.4%(-0.322)#11,962 |
| 95. | Milford City Balance | 2.1% | 2.2%(-0.136)#95 | 2.4%(-0.326)#11,973 |
| 96. | New Milford | 2.1% | 2.2%(-0.140)#96 | 2.4%(-0.330)#11,989 |
| 97. | Waterbury | 2.1% | 2.2%(-0.158)#97 | 2.4%(-0.348)#12,068 |
| 98. | Norfolk | 2.0% | 2.2%(-0.217)#98 | 2.4%(-0.407)#12,350 |
| 99. | Ridgefield | 2.0% | 2.2%(-0.236)#99 | 2.4%(-0.426)#12,449 |
| 100. | New Canaan | 1.9% | 2.2%(-0.266)#100 | 2.4%(-0.456)#12,604 |
Common Questions
What are the Top 10 Cities with the Highest Percentage of Population Employed in Wholesale Trade in Connecticut?
Top 10 Cities with the Highest Percentage of Population Employed in Wholesale Trade in Connecticut are:
#1
11.0%
#2
8.2%
#3
7.5%
#4
7.4%
#5
7.3%
#6
7.2%
#7
7.0%
#8
7.0%
#9
5.9%
#10
5.1%
What city has the Highest Percentage of Population Employed in Wholesale Trade in Connecticut?
Suffield Depot has the Highest Percentage of Population Employed in Wholesale Trade in Connecticut with 11.0%.
What is the Percentage of Population Employed in Wholesale Trade in the State of Connecticut?
Percentage of Population Employed in Wholesale Trade in Connecticut is 2.2%.
What is the Percentage of Population Employed in Wholesale Trade in the United States?
Percentage of Population Employed in Wholesale Trade in the United States is 2.4%.