Cities with the Highest Percentage of Population Employed in Wholesale Trade in Iowa
RELATED REPORTS & OPTIONS
Wholesale Trade
Iowa
Compare Cities
Map of Cities with the Highest Percentage of Population Employed in Wholesale Trade in Iowa
0.0%
50.0%
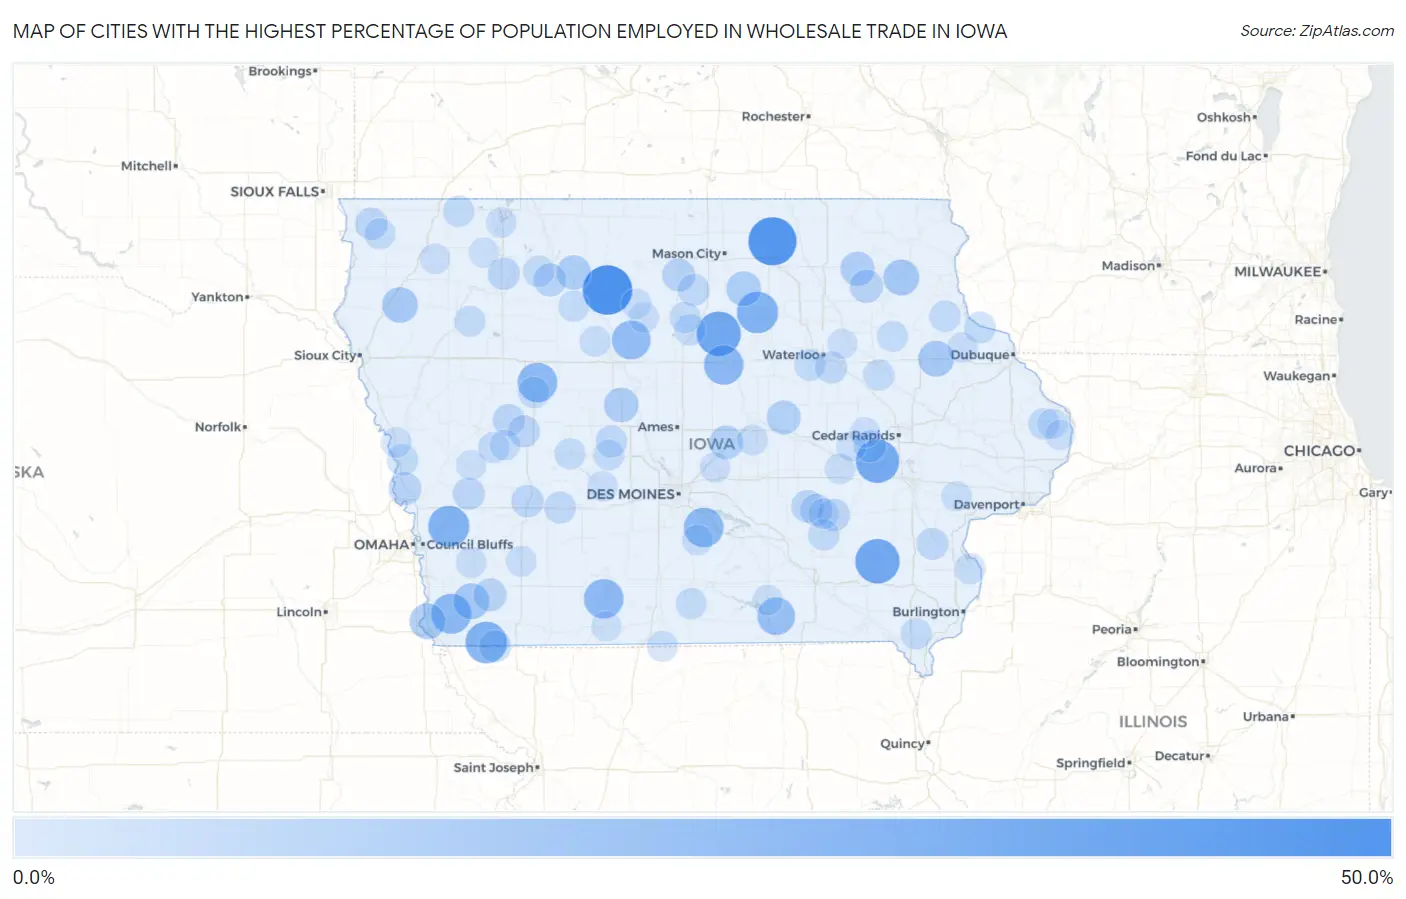
Cities with the Highest Percentage of Population Employed in Wholesale Trade in Iowa
| City | % Employed | vs State | vs National | |
| 1. | St Joseph | 44.4% | 2.7% (+41.8)#1 | 2.4% (+42.0)#41 |
| 2. | Orchard | 41.7% | 2.7% (+39.0)#2 | 2.4% (+39.3)#47 |
| 3. | Pleasant Plain | 34.2% | 2.7% (+31.5)#3 | 2.4% (+31.8)#73 |
| 4. | Bradford | 34.1% | 2.7% (+31.4)#4 | 2.4% (+31.7)#74 |
| 5. | East Amana | 32.3% | 2.7% (+29.6)#5 | 2.4% (+29.9)#94 |
| 6. | Sandusky | 29.2% | 2.7% (+26.5)#6 | 2.4% (+26.8)#109 |
| 7. | Northboro | 28.8% | 2.7% (+26.1)#7 | 2.4% (+26.4)#110 |
| 8. | Bristow | 28.4% | 2.7% (+25.7)#8 | 2.4% (+26.0)#116 |
| 9. | Bentley | 28.1% | 2.7% (+25.4)#9 | 2.4% (+25.7)#118 |
| 10. | Trenton | 26.7% | 2.7% (+24.0)#10 | 2.4% (+24.3)#125 |
| 11. | Anderson | 26.1% | 2.7% (+23.4)#11 | 2.4% (+23.7)#135 |
| 12. | Shannon City | 25.0% | 2.7% (+22.3)#12 | 2.4% (+22.6)#145 |
| 13. | Sandyville | 25.0% | 2.7% (+22.3)#13 | 2.4% (+22.6)#150 |
| 14. | Owasa | 25.0% | 2.7% (+22.3)#14 | 2.4% (+22.6)#154 |
| 15. | Yetter | 25.0% | 2.7% (+22.3)#15 | 2.4% (+22.6)#155 |
| 16. | Vincent | 23.4% | 2.7% (+20.7)#16 | 2.4% (+21.0)#167 |
| 17. | Udell | 21.4% | 2.7% (+18.7)#17 | 2.4% (+19.0)#196 |
| 18. | Imogene | 18.2% | 2.7% (+15.5)#18 | 2.4% (+15.8)#278 |
| 19. | Clermont | 18.0% | 2.7% (+15.4)#19 | 2.4% (+15.6)#286 |
| 20. | Percival | 17.9% | 2.7% (+15.3)#20 | 2.4% (+15.5)#289 |
| 21. | Delaware | 17.7% | 2.7% (+15.0)#21 | 2.4% (+15.3)#302 |
| 22. | Oyens | 17.5% | 2.7% (+14.8)#22 | 2.4% (+15.1)#314 |
| 23. | Dougherty | 15.8% | 2.7% (+13.1)#23 | 2.4% (+13.4)#376 |
| 24. | Boxholm | 15.6% | 2.7% (+12.9)#24 | 2.4% (+13.2)#389 |
| 25. | Sperry | 15.4% | 2.7% (+12.7)#25 | 2.4% (+13.0)#398 |
| 26. | Rodman | 15.4% | 2.7% (+12.7)#26 | 2.4% (+13.0)#405 |
| 27. | Oak Hills | 14.9% | 2.7% (+12.2)#27 | 2.4% (+12.5)#428 |
| 28. | Waucoma | 14.5% | 2.7% (+11.8)#28 | 2.4% (+12.1)#457 |
| 29. | Garwin | 14.4% | 2.7% (+11.7)#29 | 2.4% (+12.0)#461 |
| 30. | Rhodes | 14.0% | 2.7% (+11.3)#30 | 2.4% (+11.6)#493 |
| 31. | Hawkeye | 13.1% | 2.7% (+10.5)#31 | 2.4% (+10.7)#559 |
| 32. | Klemme | 12.6% | 2.7% (+9.93)#32 | 2.4% (+10.2)#600 |
| 33. | Coburg | 12.5% | 2.7% (+9.82)#33 | 2.4% (+10.1)#623 |
| 34. | Curlew | 12.5% | 2.7% (+9.82)#34 | 2.4% (+10.1)#624 |
| 35. | Modale | 12.2% | 2.7% (+9.54)#35 | 2.4% (+9.82)#649 |
| 36. | Barnes City | 11.5% | 2.7% (+8.86)#36 | 2.4% (+9.14)#724 |
| 37. | Brayton | 11.4% | 2.7% (+8.75)#37 | 2.4% (+9.03)#736 |
| 38. | Alvord | 11.3% | 2.7% (+8.62)#38 | 2.4% (+8.90)#750 |
| 39. | Keswick | 11.2% | 2.7% (+8.53)#39 | 2.4% (+8.81)#757 |
| 40. | Westside | 11.1% | 2.7% (+8.43)#40 | 2.4% (+8.71)#762 |
| 41. | Greenville | 11.1% | 2.7% (+8.43)#41 | 2.4% (+8.71)#769 |
| 42. | Tennant | 11.1% | 2.7% (+8.43)#42 | 2.4% (+8.71)#771 |
| 43. | Gibson | 11.1% | 2.7% (+8.43)#43 | 2.4% (+8.71)#773 |
| 44. | Blanchard | 11.1% | 2.7% (+8.43)#44 | 2.4% (+8.71)#775 |
| 45. | Halbur | 10.9% | 2.7% (+8.26)#45 | 2.4% (+8.54)#794 |
| 46. | Norway | 10.9% | 2.7% (+8.26)#46 | 2.4% (+8.54)#795 |
| 47. | Adair | 10.6% | 2.7% (+7.95)#47 | 2.4% (+8.23)#841 |
| 48. | Meservey | 10.6% | 2.7% (+7.90)#48 | 2.4% (+8.18)#845 |
| 49. | Washburn | 10.5% | 2.7% (+7.81)#49 | 2.4% (+8.09)#865 |
| 50. | Columbus City | 10.5% | 2.7% (+7.81)#50 | 2.4% (+8.09)#866 |
| 51. | Rippey | 10.2% | 2.7% (+7.52)#51 | 2.4% (+7.80)#905 |
| 52. | Garber | 10.0% | 2.7% (+7.32)#52 | 2.4% (+7.60)#940 |
| 53. | North Buena Vista | 10.0% | 2.7% (+7.32)#53 | 2.4% (+7.60)#944 |
| 54. | Auburn | 9.9% | 2.7% (+7.21)#54 | 2.4% (+7.49)#967 |
| 55. | Ayrshire | 9.9% | 2.7% (+7.19)#55 | 2.4% (+7.48)#970 |
| 56. | Little Sioux | 9.8% | 2.7% (+7.12)#56 | 2.4% (+7.40)#987 |
| 57. | Ocheyedan | 9.7% | 2.7% (+7.00)#57 | 2.4% (+7.28)#1,014 |
| 58. | Preston | 9.6% | 2.7% (+6.96)#58 | 2.4% (+7.24)#1,022 |
| 59. | Hudson | 9.6% | 2.7% (+6.95)#59 | 2.4% (+7.23)#1,026 |
| 60. | Franklin | 9.6% | 2.7% (+6.93)#60 | 2.4% (+7.21)#1,029 |
| 61. | Delta | 9.5% | 2.7% (+6.84)#61 | 2.4% (+7.12)#1,041 |
| 62. | Manilla | 9.5% | 2.7% (+6.79)#62 | 2.4% (+7.07)#1,055 |
| 63. | Rowley | 9.4% | 2.7% (+6.72)#63 | 2.4% (+7.00)#1,072 |
| 64. | Dows | 9.3% | 2.7% (+6.65)#64 | 2.4% (+6.93)#1,087 |
| 65. | Rowan | 9.3% | 2.7% (+6.58)#65 | 2.4% (+6.86)#1,102 |
| 66. | Bayard | 9.2% | 2.7% (+6.51)#66 | 2.4% (+6.79)#1,116 |
| 67. | Humeston | 9.2% | 2.7% (+6.49)#67 | 2.4% (+6.77)#1,120 |
| 68. | Aurelia | 9.1% | 2.7% (+6.46)#68 | 2.4% (+6.74)#1,125 |
| 69. | Doon | 9.1% | 2.7% (+6.41)#69 | 2.4% (+6.69)#1,132 |
| 70. | Aurora | 9.1% | 2.7% (+6.41)#70 | 2.4% (+6.69)#1,140 |
| 71. | Dawson | 9.1% | 2.7% (+6.41)#71 | 2.4% (+6.69)#1,146 |
| 72. | Rolfe | 8.9% | 2.7% (+6.25)#72 | 2.4% (+6.53)#1,183 |
| 73. | Henderson | 8.7% | 2.7% (+6.01)#73 | 2.4% (+6.29)#1,245 |
| 74. | Haverhill | 8.7% | 2.7% (+6.01)#74 | 2.4% (+6.29)#1,247 |
| 75. | Clare | 8.7% | 2.7% (+6.01)#75 | 2.4% (+6.29)#1,248 |
| 76. | Grant | 8.7% | 2.7% (+6.01)#76 | 2.4% (+6.29)#1,255 |
| 77. | Milo | 8.6% | 2.7% (+5.87)#77 | 2.4% (+6.15)#1,294 |
| 78. | Oakville | 8.5% | 2.7% (+5.85)#78 | 2.4% (+6.14)#1,302 |
| 79. | Pleasanton | 8.3% | 2.7% (+5.65)#79 | 2.4% (+5.93)#1,361 |
| 80. | Thornburg | 8.3% | 2.7% (+5.65)#80 | 2.4% (+5.93)#1,362 |
| 81. | Aspinwall | 8.3% | 2.7% (+5.65)#81 | 2.4% (+5.93)#1,368 |
| 82. | Ladora | 8.2% | 2.7% (+5.53)#82 | 2.4% (+5.81)#1,405 |
| 83. | Archer | 8.2% | 2.7% (+5.51)#83 | 2.4% (+5.80)#1,410 |
| 84. | Blencoe | 8.2% | 2.7% (+5.50)#84 | 2.4% (+5.78)#1,414 |
| 85. | Moravia | 8.1% | 2.7% (+5.44)#85 | 2.4% (+5.72)#1,427 |
| 86. | Mingo | 8.1% | 2.7% (+5.41)#86 | 2.4% (+5.69)#1,433 |
| 87. | New Vienna | 8.1% | 2.7% (+5.40)#87 | 2.4% (+5.68)#1,440 |
| 88. | Goldfield | 8.0% | 2.7% (+5.35)#88 | 2.4% (+5.63)#1,447 |
| 89. | Newhall | 8.0% | 2.7% (+5.35)#89 | 2.4% (+5.63)#1,448 |
| 90. | Linden | 7.9% | 2.7% (+5.21)#90 | 2.4% (+5.49)#1,497 |
| 91. | Renwick | 7.8% | 2.7% (+5.15)#91 | 2.4% (+5.43)#1,522 |
| 92. | West Okoboji | 7.8% | 2.7% (+5.12)#92 | 2.4% (+5.40)#1,531 |
| 93. | Atalissa | 7.8% | 2.7% (+5.08)#93 | 2.4% (+5.36)#1,548 |
| 94. | Miles | 7.7% | 2.7% (+4.97)#94 | 2.4% (+5.25)#1,591 |
| 95. | Everly | 7.6% | 2.7% (+4.89)#95 | 2.4% (+5.17)#1,617 |
| 96. | Blairstown | 7.6% | 2.7% (+4.88)#96 | 2.4% (+5.16)#1,619 |
| 97. | Mount Ayr | 7.4% | 2.7% (+4.74)#97 | 2.4% (+5.02)#1,661 |
| 98. | Earling | 7.4% | 2.7% (+4.73)#98 | 2.4% (+5.01)#1,672 |
| 99. | Andover | 7.3% | 2.7% (+4.64)#99 | 2.4% (+4.92)#1,719 |
| 100. | Dunkerton | 7.3% | 2.7% (+4.62)#100 | 2.4% (+4.90)#1,722 |
Common Questions
What are the Top 10 Cities with the Highest Percentage of Population Employed in Wholesale Trade in Iowa?
Top 10 Cities with the Highest Percentage of Population Employed in Wholesale Trade in Iowa are:
#1
44.4%
#2
41.7%
#3
34.2%
#4
34.1%
#5
32.3%
#6
28.8%
#7
28.4%
#8
28.1%
#9
26.1%
#10
25.0%
What city has the Highest Percentage of Population Employed in Wholesale Trade in Iowa?
St Joseph has the Highest Percentage of Population Employed in Wholesale Trade in Iowa with 44.4%.
What is the Percentage of Population Employed in Wholesale Trade in the State of Iowa?
Percentage of Population Employed in Wholesale Trade in Iowa is 2.7%.
What is the Percentage of Population Employed in Wholesale Trade in the United States?
Percentage of Population Employed in Wholesale Trade in the United States is 2.4%.