Cities with the Highest Percentage of Population Employed in Wholesale Trade in Vermont
RELATED REPORTS & OPTIONS
Wholesale Trade
Vermont
Compare Cities
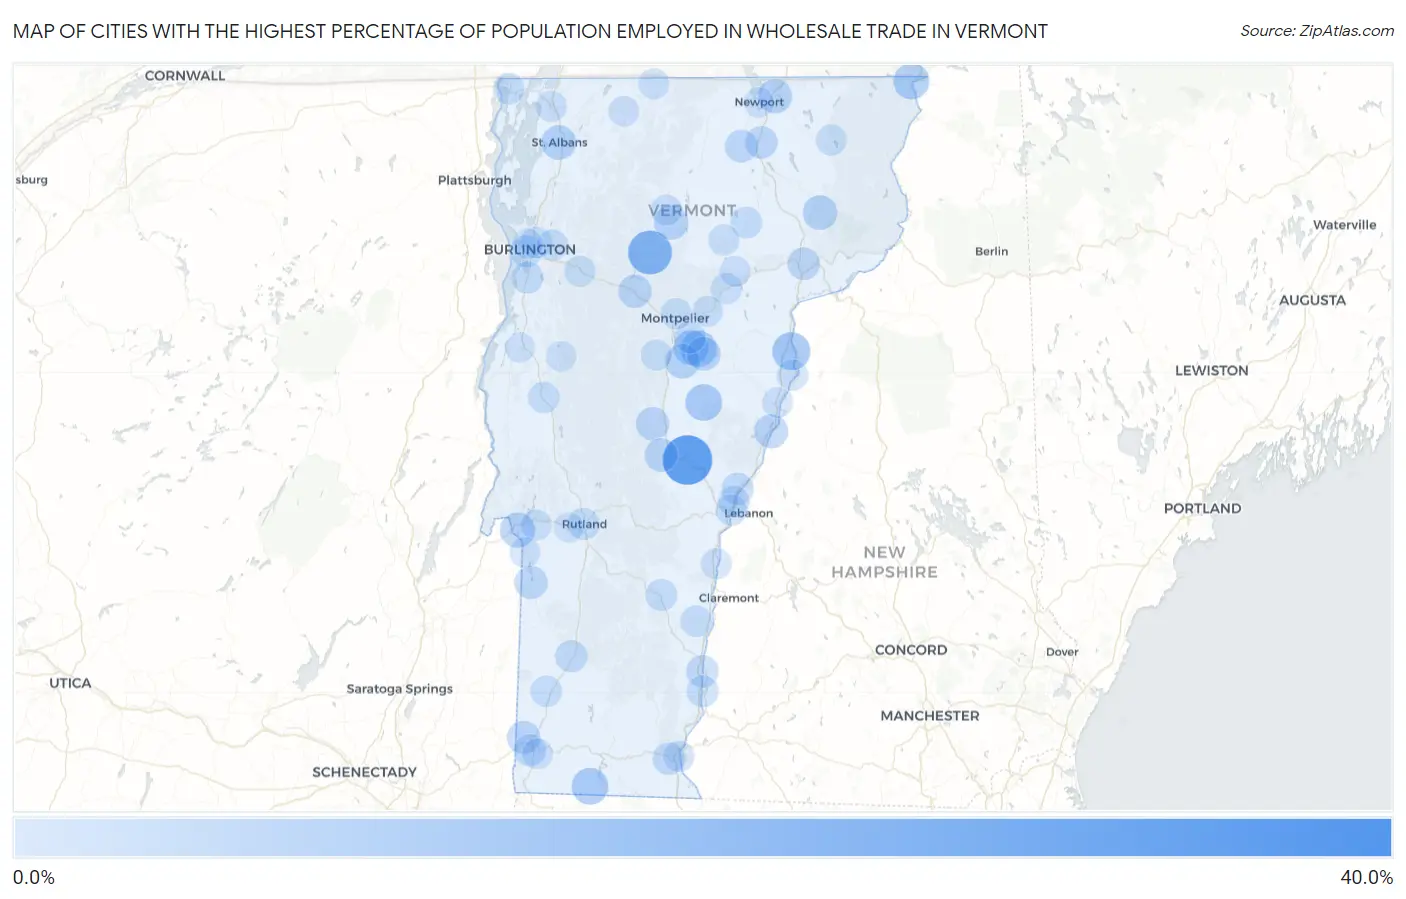
Map of Cities with the Highest Percentage of Population Employed in Wholesale Trade in Vermont
0.0%
40.0%
Cities with the Highest Percentage of Population Employed in Wholesale Trade in Vermont
| City | % Employed | vs State | vs National | |
| 1. | Stratton Mountain | 33.3% | 1.8%(+31.6)#1 | 2.4%(+30.9)#80 |
| 2. | South Royalton | 28.0% | 1.8%(+26.3)#2 | 2.4%(+25.6)#120 |
| 3. | Bolton | 20.0% | 1.8%(+18.2)#3 | 2.4%(+17.6)#232 |
| 4. | Stowe | 19.6% | 1.8%(+17.8)#4 | 2.4%(+17.2)#237 |
| 5. | Algiers | 12.1% | 1.8%(+10.3)#5 | 2.4%(+9.66)#670 |
| 6. | Wells River | 11.0% | 1.8%(+9.26)#6 | 2.4%(+8.62)#785 |
| 7. | Chelsea | 9.1% | 1.8%(+7.33)#7 | 2.4%(+6.69)#1,133 |
| 8. | Readsboro | 9.0% | 1.8%(+7.24)#8 | 2.4%(+6.59)#1,170 |
| 9. | East Poultney | 8.7% | 1.8%(+6.94)#9 | 2.4%(+6.29)#1,244 |
| 10. | Websterville | 8.5% | 1.8%(+6.74)#10 | 2.4%(+6.10)#1,311 |
| 11. | Canaan | 8.3% | 1.8%(+6.58)#11 | 2.4%(+5.93)#1,348 |
| 12. | Underhill Flats | 8.2% | 1.8%(+6.43)#12 | 2.4%(+5.79)#1,412 |
| 13. | Lunenburg | 7.9% | 1.8%(+6.12)#13 | 2.4%(+5.47)#1,506 |
| 14. | St. George | 7.2% | 1.8%(+5.42)#14 | 2.4%(+4.78)#1,780 |
| 15. | Fair Haven | 6.9% | 1.8%(+5.15)#15 | 2.4%(+4.51)#1,927 |
| 16. | South Barre | 6.9% | 1.8%(+5.14)#16 | 2.4%(+4.49)#1,948 |
| 17. | Williamstown | 6.2% | 1.8%(+4.40)#17 | 2.4%(+3.76)#2,391 |
| 18. | St Albans | 6.1% | 1.8%(+4.38)#18 | 2.4%(+3.73)#2,405 |
| 19. | Proctor | 6.1% | 1.8%(+4.30)#19 | 2.4%(+3.66)#2,449 |
| 20. | East Burke | 6.0% | 1.8%(+4.27)#20 | 2.4%(+3.62)#2,477 |
| 21. | Morrisville | 6.0% | 1.8%(+4.20)#21 | 2.4%(+3.55)#2,531 |
| 22. | West Woodstock | 5.8% | 1.8%(+4.07)#22 | 2.4%(+3.43)#2,628 |
| 23. | Derby Center | 5.7% | 1.8%(+3.97)#23 | 2.4%(+3.32)#2,703 |
| 24. | South Lincoln | 5.6% | 1.8%(+3.85)#24 | 2.4%(+3.21)#2,816 |
| 25. | Fairlee | 5.2% | 1.8%(+3.42)#25 | 2.4%(+2.77)#3,287 |
| 26. | East Barre | 5.1% | 1.8%(+3.38)#26 | 2.4%(+2.74)#3,324 |
| 27. | East Charlotte | 4.9% | 1.8%(+3.12)#27 | 2.4%(+2.48)#3,627 |
| 28. | Randolph | 4.7% | 1.8%(+2.95)#28 | 2.4%(+2.30)#3,885 |
| 29. | Bethel | 4.7% | 1.8%(+2.93)#29 | 2.4%(+2.28)#3,906 |
| 30. | North Bennington | 4.5% | 1.8%(+2.70)#30 | 2.4%(+2.06)#4,271 |
| 31. | Waterbury | 4.4% | 1.8%(+2.66)#31 | 2.4%(+2.01)#4,354 |
| 32. | Castleton Four Corners | 4.4% | 1.8%(+2.60)#32 | 2.4%(+1.96)#4,443 |
| 33. | Westford | 4.3% | 1.8%(+2.54)#33 | 2.4%(+1.90)#4,577 |
| 34. | Danby | 4.0% | 1.8%(+2.28)#34 | 2.4%(+1.64)#5,062 |
| 35. | Wells | 4.0% | 1.8%(+2.26)#35 | 2.4%(+1.62)#5,108 |
| 36. | Irasburg | 3.7% | 1.8%(+1.99)#36 | 2.4%(+1.35)#5,736 |
| 37. | St Johnsbury | 3.4% | 1.8%(+1.63)#37 | 2.4%(+0.990)#6,676 |
| 38. | Stamford | 3.4% | 1.8%(+1.63)#38 | 2.4%(+0.988)#6,686 |
| 39. | Orleans | 3.4% | 1.8%(+1.60)#39 | 2.4%(+0.953)#6,799 |
| 40. | Bellows Falls | 3.3% | 1.8%(+1.53)#40 | 2.4%(+0.881)#7,030 |
| 41. | West Brattleboro | 3.2% | 1.8%(+1.43)#41 | 2.4%(+0.780)#7,345 |
| 42. | Manchester Center | 3.0% | 1.8%(+1.20)#42 | 2.4%(+0.552)#8,131 |
| 43. | Norwich | 2.9% | 1.8%(+1.13)#43 | 2.4%(+0.486)#8,383 |
| 44. | South Burlington | 2.7% | 1.8%(+0.968)#44 | 2.4%(+0.322)#9,049 |
| 45. | Rutland | 2.7% | 1.8%(+0.929)#45 | 2.4%(+0.284)#9,207 |
| 46. | Westminster | 2.6% | 1.8%(+0.846)#46 | 2.4%(+0.201)#9,572 |
| 47. | Shelburne | 2.6% | 1.8%(+0.806)#47 | 2.4%(+0.161)#9,749 |
| 48. | Barre | 2.4% | 1.8%(+0.689)#48 | 2.4%(+0.044)#10,242 |
| 49. | Proctorsville | 2.4% | 1.8%(+0.671)#49 | 2.4%(+0.026)#10,326 |
| 50. | West Pawlet | 2.4% | 1.8%(+0.653)#50 | 2.4%(+0.008)#10,398 |
| 51. | Old Bennington | 2.4% | 1.8%(+0.653)#51 | 2.4%(+0.008)#10,404 |
| 52. | New Haven | 2.3% | 1.8%(+0.534)#52 | 2.4%(-0.111)#10,944 |
| 53. | Greensboro Bend | 2.2% | 1.8%(+0.402)#53 | 2.4%(-0.243)#11,591 |
| 54. | Springfield | 2.1% | 1.8%(+0.362)#54 | 2.4%(-0.283)#11,772 |
| 55. | Winooski | 2.0% | 1.8%(+0.227)#55 | 2.4%(-0.419)#12,409 |
| 56. | Middlebury | 1.9% | 1.8%(+0.191)#56 | 2.4%(-0.454)#12,593 |
| 57. | Alburgh | 1.8% | 1.8%(+0.079)#57 | 2.4%(-0.567)#13,148 |
| 58. | Arlington | 1.8% | 1.8%(+0.034)#58 | 2.4%(-0.612)#13,352 |
| 59. | White River Junction | 1.8% | 1.8%(-0.006)#59 | 2.4%(-0.651)#13,558 |
| 60. | Newbury | 1.6% | 1.8%(-0.135)#60 | 2.4%(-0.780)#14,225 |
| 61. | Marshfield | 1.6% | 1.8%(-0.135)#61 | 2.4%(-0.780)#14,226 |
| 62. | Wilder | 1.6% | 1.8%(-0.163)#62 | 2.4%(-0.808)#14,372 |
| 63. | Richmond | 1.5% | 1.8%(-0.241)#63 | 2.4%(-0.886)#14,746 |
| 64. | Montpelier | 1.5% | 1.8%(-0.244)#64 | 2.4%(-0.890)#14,768 |
| 65. | Hardwick | 1.4% | 1.8%(-0.323)#65 | 2.4%(-0.968)#15,151 |
| 66. | Swanton | 1.4% | 1.8%(-0.325)#66 | 2.4%(-0.970)#15,160 |
| 67. | Essex Junction | 1.4% | 1.8%(-0.335)#67 | 2.4%(-0.980)#15,216 |
| 68. | Hyde Park | 1.4% | 1.8%(-0.348)#68 | 2.4%(-0.993)#15,283 |
| 69. | Brattleboro | 1.3% | 1.8%(-0.421)#69 | 2.4%(-1.07)#15,629 |
| 70. | Northfield | 1.3% | 1.8%(-0.453)#70 | 2.4%(-1.10)#15,783 |
| 71. | Island Pond | 1.3% | 1.8%(-0.490)#71 | 2.4%(-1.14)#15,968 |
| 72. | Plainfield | 1.2% | 1.8%(-0.566)#72 | 2.4%(-1.21)#16,330 |
| 73. | Castleton | 1.2% | 1.8%(-0.573)#73 | 2.4%(-1.22)#16,362 |
| 74. | Huntington | 1.0% | 1.8%(-0.711)#74 | 2.4%(-1.36)#17,019 |
| 75. | Bradford | 0.98% | 1.8%(-0.777)#75 | 2.4%(-1.42)#17,316 |
| 76. | Cabot | 0.92% | 1.8%(-0.839)#76 | 2.4%(-1.48)#17,606 |
| 77. | Windsor | 0.83% | 1.8%(-0.921)#77 | 2.4%(-1.57)#17,962 |
| 78. | Richford | 0.83% | 1.8%(-0.924)#78 | 2.4%(-1.57)#17,980 |
| 79. | Bennington | 0.81% | 1.8%(-0.947)#79 | 2.4%(-1.59)#18,077 |
| 80. | Enosburg Falls | 0.75% | 1.8%(-1.01)#80 | 2.4%(-1.65)#18,350 |
| 81. | Poultney | 0.64% | 1.8%(-1.11)#81 | 2.4%(-1.76)#18,778 |
| 82. | Bristol | 0.49% | 1.8%(-1.26)#82 | 2.4%(-1.91)#19,330 |
| 83. | Newport | 0.49% | 1.8%(-1.27)#83 | 2.4%(-1.91)#19,341 |
| 84. | Burlington | 0.48% | 1.8%(-1.28)#84 | 2.4%(-1.92)#19,366 |
| 85. | West Rutland | 0.37% | 1.8%(-1.39)#85 | 2.4%(-2.03)#19,703 |
| 86. | Vergennes | 0.26% | 1.8%(-1.50)#86 | 2.4%(-2.14)#19,920 |
1
2Common Questions
What are the Top 10 Cities with the Highest Percentage of Population Employed in Wholesale Trade in Vermont?
Top 10 Cities with the Highest Percentage of Population Employed in Wholesale Trade in Vermont are:
#1
28.0%
#2
19.6%
#3
11.0%
#4
9.1%
#5
9.0%
#6
8.5%
#7
8.3%
#8
6.9%
#9
6.9%
#10
6.2%
What city has the Highest Percentage of Population Employed in Wholesale Trade in Vermont?
South Royalton has the Highest Percentage of Population Employed in Wholesale Trade in Vermont with 28.0%.
What is the Percentage of Population Employed in Wholesale Trade in the State of Vermont?
Percentage of Population Employed in Wholesale Trade in Vermont is 1.8%.
What is the Percentage of Population Employed in Wholesale Trade in the United States?
Percentage of Population Employed in Wholesale Trade in the United States is 2.4%.