Cities with the Highest Percentage of Population Employed in Arts, Media & Entertainment in Vermont
RELATED REPORTS & OPTIONS
Arts, Media & Entertainment
Vermont
Compare Cities
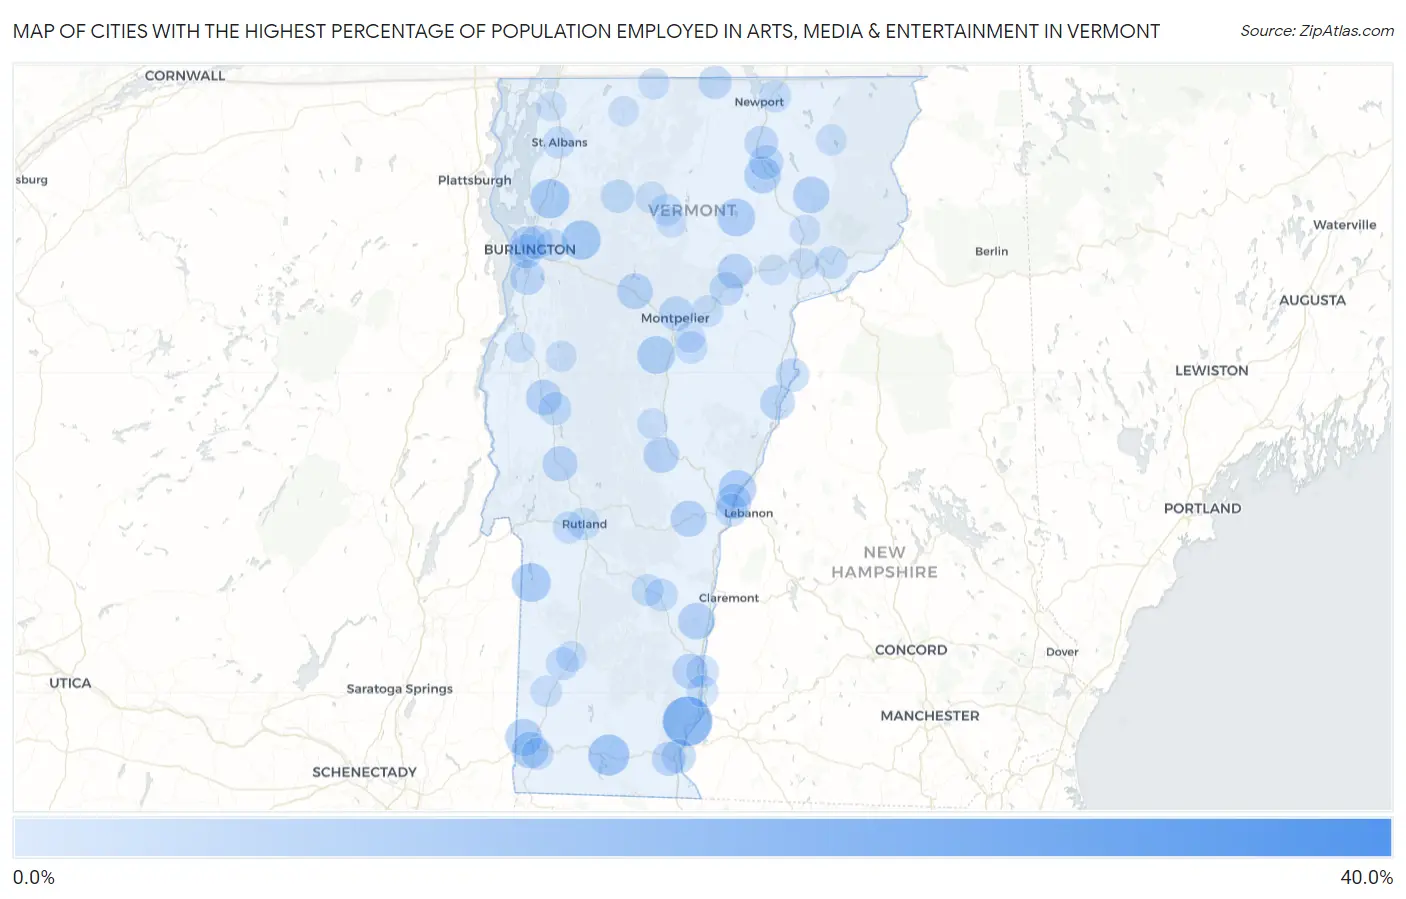
Map of Cities with the Highest Percentage of Population Employed in Arts, Media & Entertainment in Vermont
0.0%
40.0%
Cities with the Highest Percentage of Population Employed in Arts, Media & Entertainment in Vermont
| City | % Employed | vs State | vs National | |
| 1. | Weston | 33.3% | 2.7%(+30.7)#1 | 2.1%(+31.3)#41 |
| 2. | West Woodstock | 31.8% | 2.7%(+29.2)#2 | 2.1%(+29.8)#44 |
| 3. | Putney | 18.1% | 2.7%(+15.4)#3 | 2.1%(+16.0)#126 |
| 4. | Grafton | 14.8% | 2.7%(+12.1)#4 | 2.1%(+12.8)#191 |
| 5. | Wilmington | 10.1% | 2.7%(+7.47)#5 | 2.1%(+8.08)#372 |
| 6. | Westford | 8.6% | 2.7%(+5.93)#6 | 2.1%(+6.54)#508 |
| 7. | Milton | 8.5% | 2.7%(+5.86)#7 | 2.1%(+6.48)#517 |
| 8. | Jericho | 8.4% | 2.7%(+5.77)#8 | 2.1%(+6.38)#533 |
| 9. | Chittenden | 8.2% | 2.7%(+5.57)#9 | 2.1%(+6.19)#557 |
| 10. | Wells | 8.0% | 2.7%(+5.36)#10 | 2.1%(+5.97)#587 |
| 11. | Greensboro | 7.1% | 2.7%(+4.47)#11 | 2.1%(+5.08)#764 |
| 12. | Northfield | 7.1% | 2.7%(+4.45)#12 | 2.1%(+5.06)#769 |
| 13. | Norwich | 6.8% | 2.7%(+4.15)#13 | 2.1%(+4.76)#831 |
| 14. | Middletown Springs | 6.6% | 2.7%(+3.90)#14 | 2.1%(+4.52)#884 |
| 15. | North Bennington | 6.3% | 2.7%(+3.67)#15 | 2.1%(+4.29)#953 |
| 16. | Glover | 6.2% | 2.7%(+3.48)#16 | 2.1%(+4.09)#1,005 |
| 17. | Old Bennington | 6.0% | 2.7%(+3.35)#17 | 2.1%(+3.96)#1,041 |
| 18. | Springfield | 5.9% | 2.7%(+3.23)#18 | 2.1%(+3.84)#1,096 |
| 19. | West Burke | 5.9% | 2.7%(+3.21)#19 | 2.1%(+3.82)#1,107 |
| 20. | Woodstock | 5.6% | 2.7%(+2.88)#20 | 2.1%(+3.49)#1,226 |
| 21. | Bethel | 5.2% | 2.7%(+2.56)#21 | 2.1%(+3.17)#1,397 |
| 22. | Waterbury | 5.1% | 2.7%(+2.44)#22 | 2.1%(+3.05)#1,457 |
| 23. | Middlebury | 5.1% | 2.7%(+2.38)#23 | 2.1%(+3.00)#1,482 |
| 24. | Lincoln | 4.9% | 2.7%(+2.20)#24 | 2.1%(+2.82)#1,594 |
| 25. | Burlington | 4.8% | 2.7%(+2.10)#25 | 2.1%(+2.71)#1,666 |
| 26. | Brandon | 4.7% | 2.7%(+1.99)#26 | 2.1%(+2.60)#1,740 |
| 27. | Cabot | 4.6% | 2.7%(+1.91)#27 | 2.1%(+2.53)#1,788 |
| 28. | Wilder | 4.6% | 2.7%(+1.91)#28 | 2.1%(+2.52)#1,795 |
| 29. | New Haven | 4.6% | 2.7%(+1.90)#29 | 2.1%(+2.52)#1,796 |
| 30. | Saxtons River | 4.5% | 2.7%(+1.84)#30 | 2.1%(+2.46)#1,843 |
| 31. | South Hero | 4.4% | 2.7%(+1.72)#31 | 2.1%(+2.33)#1,934 |
| 32. | Shelburne | 4.4% | 2.7%(+1.70)#32 | 2.1%(+2.31)#1,948 |
| 33. | Bradford | 4.3% | 2.7%(+1.66)#33 | 2.1%(+2.27)#1,980 |
| 34. | Montpelier | 4.2% | 2.7%(+1.50)#34 | 2.1%(+2.12)#2,102 |
| 35. | Lunenburg | 3.9% | 2.7%(+1.26)#35 | 2.1%(+1.88)#2,327 |
| 36. | Brattleboro | 3.8% | 2.7%(+1.11)#36 | 2.1%(+1.73)#2,486 |
| 37. | South Burlington | 3.8% | 2.7%(+1.10)#37 | 2.1%(+1.71)#2,506 |
| 38. | Barton | 3.8% | 2.7%(+1.09)#38 | 2.1%(+1.70)#2,517 |
| 39. | Bolton Valley | 3.8% | 2.7%(+1.08)#39 | 2.1%(+1.70)#2,529 |
| 40. | North Clarendon | 3.6% | 2.7%(+0.925)#40 | 2.1%(+1.54)#2,711 |
| 41. | West Brattleboro | 3.6% | 2.7%(+0.921)#41 | 2.1%(+1.54)#2,718 |
| 42. | Pawlet | 3.4% | 2.7%(+0.686)#42 | 2.1%(+1.30)#3,052 |
| 43. | Jeffersonville | 3.3% | 2.7%(+0.581)#43 | 2.1%(+1.19)#3,238 |
| 44. | Newbury | 3.2% | 2.7%(+0.568)#44 | 2.1%(+1.18)#3,254 |
| 45. | Marshfield | 3.2% | 2.7%(+0.568)#45 | 2.1%(+1.18)#3,255 |
| 46. | Winooski | 3.2% | 2.7%(+0.561)#46 | 2.1%(+1.18)#3,272 |
| 47. | Huntington Center | 3.2% | 2.7%(+0.551)#47 | 2.1%(+1.16)#3,295 |
| 48. | Orleans | 3.1% | 2.7%(+0.469)#48 | 2.1%(+1.08)#3,447 |
| 49. | West Pawlet | 3.0% | 2.7%(+0.337)#49 | 2.1%(+0.951)#3,680 |
| 50. | North Troy | 3.0% | 2.7%(+0.310)#50 | 2.1%(+0.924)#3,740 |
| 51. | Algiers | 2.8% | 2.7%(+0.162)#51 | 2.1%(+0.776)#4,077 |
| 52. | South Lincoln | 2.8% | 2.7%(+0.129)#52 | 2.1%(+0.743)#4,168 |
| 53. | East Middlebury | 2.8% | 2.7%(+0.122)#53 | 2.1%(+0.736)#4,180 |
| 54. | Manchester | 2.7% | 2.7%(+0.052)#54 | 2.1%(+0.666)#4,350 |
| 55. | Concord | 2.7% | 2.7%(+0.028)#55 | 2.1%(+0.642)#4,422 |
| 56. | White River Junction | 2.6% | 2.7%(-0.122)#56 | 2.1%(+0.492)#4,818 |
| 57. | Bellows Falls | 2.5% | 2.7%(-0.130)#57 | 2.1%(+0.484)#4,840 |
| 58. | Underhill Flats | 2.5% | 2.7%(-0.194)#58 | 2.1%(+0.420)#5,037 |
| 59. | Proctorsville | 2.4% | 2.7%(-0.248)#59 | 2.1%(+0.366)#5,216 |
| 60. | Rutland | 2.2% | 2.7%(-0.499)#60 | 2.1%(+0.115)#6,049 |
| 61. | South Barre | 2.1% | 2.7%(-0.577)#61 | 2.1%(+0.037)#6,359 |
| 62. | Derby Center | 2.0% | 2.7%(-0.685)#62 | 2.1%(-0.071)#6,789 |
| 63. | St Albans | 1.9% | 2.7%(-0.734)#63 | 2.1%(-0.119)#6,974 |
| 64. | Hyde Park | 1.9% | 2.7%(-0.797)#64 | 2.1%(-0.183)#7,237 |
| 65. | Westminster | 1.9% | 2.7%(-0.816)#65 | 2.1%(-0.202)#7,324 |
| 66. | Ludlow | 1.8% | 2.7%(-0.848)#66 | 2.1%(-0.233)#7,485 |
| 67. | Bennington | 1.8% | 2.7%(-0.896)#67 | 2.1%(-0.281)#7,684 |
| 68. | West Rutland | 1.7% | 2.7%(-0.929)#68 | 2.1%(-0.315)#7,836 |
| 69. | Bakersfield | 1.7% | 2.7%(-0.951)#69 | 2.1%(-0.337)#7,937 |
| 70. | Stamford | 1.7% | 2.7%(-0.980)#70 | 2.1%(-0.366)#8,073 |
| 71. | Essex Junction | 1.7% | 2.7%(-1.02)#71 | 2.1%(-0.411)#8,272 |
| 72. | Plainfield | 1.6% | 2.7%(-1.09)#72 | 2.1%(-0.474)#8,595 |
| 73. | Arlington | 1.6% | 2.7%(-1.11)#73 | 2.1%(-0.495)#8,728 |
| 74. | Johnson | 1.6% | 2.7%(-1.11)#74 | 2.1%(-0.498)#8,744 |
| 75. | Huntington | 1.0% | 2.7%(-1.63)#75 | 2.1%(-1.02)#11,510 |
| 76. | Richford | 1.00% | 2.7%(-1.68)#76 | 2.1%(-1.06)#11,750 |
| 77. | Proctor | 0.96% | 2.7%(-1.71)#77 | 2.1%(-1.10)#11,942 |
| 78. | Island Pond | 0.95% | 2.7%(-1.73)#78 | 2.1%(-1.11)#12,038 |
| 79. | Bristol | 0.89% | 2.7%(-1.79)#79 | 2.1%(-1.17)#12,367 |
| 80. | St Johnsbury | 0.88% | 2.7%(-1.79)#80 | 2.1%(-1.18)#12,391 |
| 81. | Morrisville | 0.71% | 2.7%(-1.97)#81 | 2.1%(-1.35)#13,372 |
| 82. | Randolph | 0.63% | 2.7%(-2.04)#82 | 2.1%(-1.43)#13,820 |
| 83. | Manchester Center | 0.63% | 2.7%(-2.04)#83 | 2.1%(-1.43)#13,821 |
| 84. | Lyndonville | 0.61% | 2.7%(-2.06)#84 | 2.1%(-1.45)#13,946 |
| 85. | Barre | 0.60% | 2.7%(-2.07)#85 | 2.1%(-1.46)#13,981 |
| 86. | Enosburg Falls | 0.60% | 2.7%(-2.08)#86 | 2.1%(-1.46)#14,013 |
| 87. | Danville | 0.39% | 2.7%(-2.28)#87 | 2.1%(-1.67)#15,184 |
| 88. | Swanton | 0.38% | 2.7%(-2.29)#88 | 2.1%(-1.68)#15,221 |
| 89. | Vergennes | 0.33% | 2.7%(-2.35)#89 | 2.1%(-1.73)#15,435 |
1
2Common Questions
What are the Top 10 Cities with the Highest Percentage of Population Employed in Arts, Media & Entertainment in Vermont?
Top 10 Cities with the Highest Percentage of Population Employed in Arts, Media & Entertainment in Vermont are:
#1
18.1%
#2
10.1%
#3
8.5%
#4
8.4%
#5
8.0%
#6
7.1%
#7
7.1%
#8
6.8%
#9
6.3%
#10
6.2%
What city has the Highest Percentage of Population Employed in Arts, Media & Entertainment in Vermont?
Putney has the Highest Percentage of Population Employed in Arts, Media & Entertainment in Vermont with 18.1%.
What is the Percentage of Population Employed in Arts, Media & Entertainment in the State of Vermont?
Percentage of Population Employed in Arts, Media & Entertainment in Vermont is 2.7%.
What is the Percentage of Population Employed in Arts, Media & Entertainment in the United States?
Percentage of Population Employed in Arts, Media & Entertainment in the United States is 2.1%.