Cities with the Highest Percentage of Population Employed in Arts, Media & Entertainment in Michigan
RELATED REPORTS & OPTIONS
Arts, Media & Entertainment
Michigan
Compare Cities
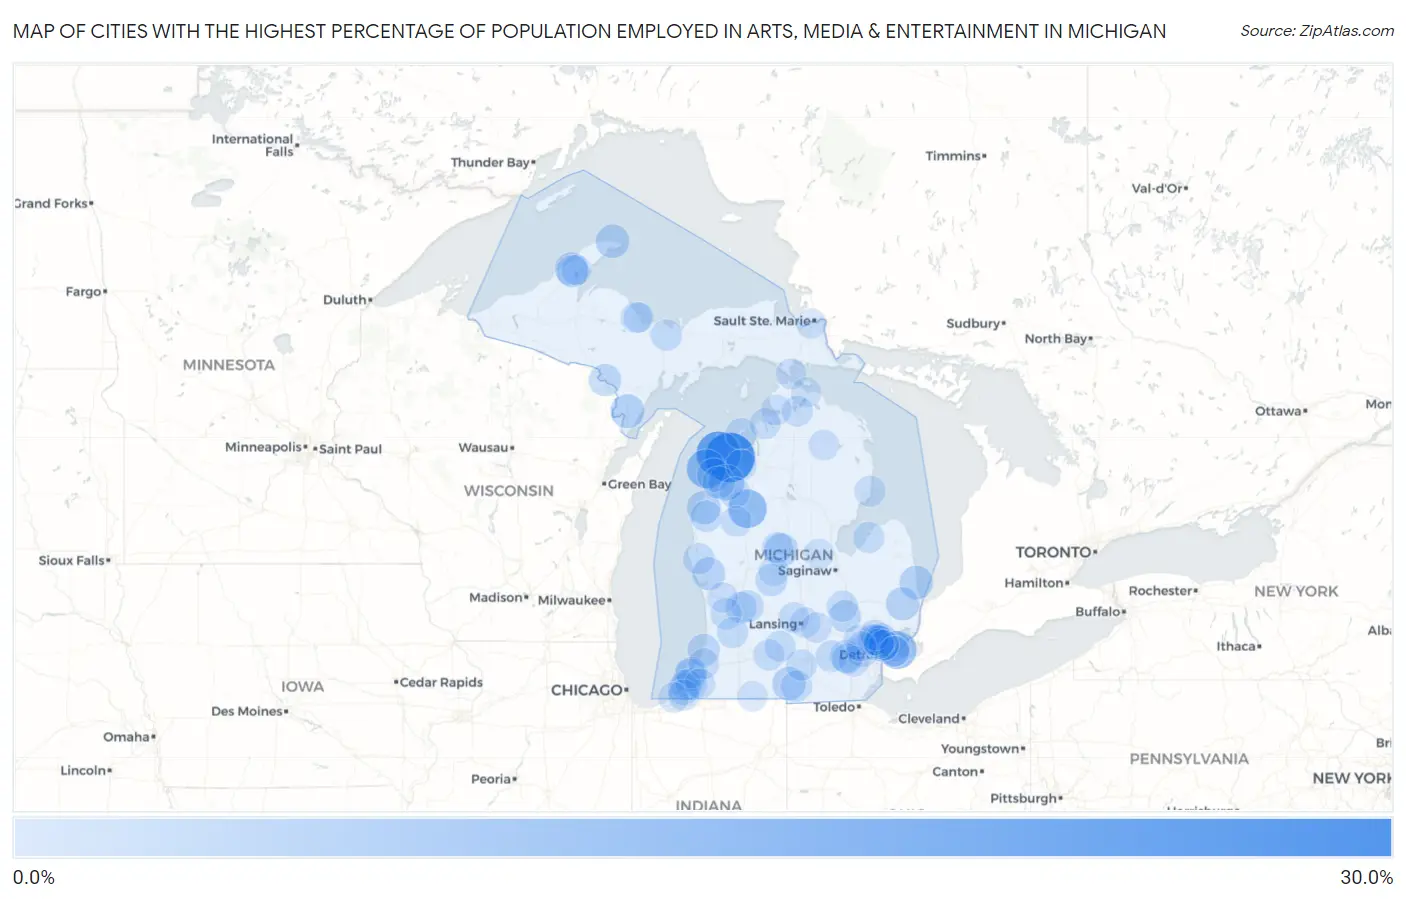
Map of Cities with the Highest Percentage of Population Employed in Arts, Media & Entertainment in Michigan
0.0%
30.0%
Cities with the Highest Percentage of Population Employed in Arts, Media & Entertainment in Michigan
| City | % Employed | vs State | vs National | |
| 1. | Cedar | 30.0% | 1.7%(+28.3)#1 | 2.1%(+27.9)#48 |
| 2. | Glen Arbor | 23.0% | 1.7%(+21.3)#2 | 2.1%(+20.9)#81 |
| 3. | Crystal Downs Country Club | 15.0% | 1.7%(+13.3)#3 | 2.1%(+12.9)#183 |
| 4. | Rock | 14.6% | 1.7%(+12.9)#4 | 2.1%(+12.5)#198 |
| 5. | Wedgewood | 14.3% | 1.7%(+12.6)#5 | 2.1%(+12.2)#205 |
| 6. | Grosse Pointe Farms | 13.6% | 1.7%(+11.9)#6 | 2.1%(+11.5)#227 |
| 7. | Nessen City | 10.7% | 1.7%(+9.01)#7 | 2.1%(+8.65)#340 |
| 8. | Pleasant Ridge | 9.5% | 1.7%(+7.83)#8 | 2.1%(+7.48)#421 |
| 9. | Stephenson | 7.7% | 1.7%(+5.95)#9 | 2.1%(+5.59)#657 |
| 10. | Mears | 7.5% | 1.7%(+5.82)#10 | 2.1%(+5.46)#683 |
| 11. | Fulton | 7.4% | 1.7%(+5.71)#11 | 2.1%(+5.35)#705 |
| 12. | Copper Harbor | 7.4% | 1.7%(+5.71)#12 | 2.1%(+5.35)#706 |
| 13. | Lexington | 7.4% | 1.7%(+5.67)#13 | 2.1%(+5.31)#709 |
| 14. | Benzonia | 7.3% | 1.7%(+5.61)#14 | 2.1%(+5.26)#721 |
| 15. | Stronach | 7.3% | 1.7%(+5.59)#15 | 2.1%(+5.23)#728 |
| 16. | Beal City | 7.2% | 1.7%(+5.53)#16 | 2.1%(+5.17)#742 |
| 17. | Allen | 7.1% | 1.7%(+5.44)#17 | 2.1%(+5.08)#762 |
| 18. | Emmett | 6.9% | 1.7%(+5.22)#18 | 2.1%(+4.86)#807 |
| 19. | Hancock | 6.6% | 1.7%(+4.92)#19 | 2.1%(+4.56)#870 |
| 20. | Twin Lake | 6.4% | 1.7%(+4.73)#20 | 2.1%(+4.37)#934 |
| 21. | Barton Hills | 6.0% | 1.7%(+4.32)#21 | 2.1%(+3.96)#1,040 |
| 22. | Ferndale | 6.0% | 1.7%(+4.31)#22 | 2.1%(+3.95)#1,043 |
| 23. | Crystal Mountain | 5.9% | 1.7%(+4.18)#23 | 2.1%(+3.82)#1,108 |
| 24. | Quinnesec | 5.6% | 1.7%(+3.91)#24 | 2.1%(+3.55)#1,205 |
| 25. | South Haven | 5.6% | 1.7%(+3.85)#25 | 2.1%(+3.49)#1,238 |
| 26. | Houghton | 5.5% | 1.7%(+3.80)#26 | 2.1%(+3.44)#1,263 |
| 27. | Shoreham | 5.5% | 1.7%(+3.79)#27 | 2.1%(+3.44)#1,264 |
| 28. | Linden | 5.4% | 1.7%(+3.65)#28 | 2.1%(+3.29)#1,339 |
| 29. | Lakeport | 5.3% | 1.7%(+3.58)#29 | 2.1%(+3.22)#1,372 |
| 30. | Huntington Woods | 5.3% | 1.7%(+3.56)#30 | 2.1%(+3.20)#1,390 |
| 31. | Forest Hills | 5.2% | 1.7%(+3.52)#31 | 2.1%(+3.17)#1,403 |
| 32. | Stanton | 5.2% | 1.7%(+3.47)#32 | 2.1%(+3.11)#1,427 |
| 33. | Skanee | 5.1% | 1.7%(+3.43)#33 | 2.1%(+3.07)#1,453 |
| 34. | Shorewood Tower Hills Harbert | 5.0% | 1.7%(+3.31)#34 | 2.1%(+2.95)#1,507 |
| 35. | Plymouth | 4.8% | 1.7%(+3.14)#35 | 2.1%(+2.78)#1,619 |
| 36. | Baroda | 4.8% | 1.7%(+3.14)#36 | 2.1%(+2.78)#1,629 |
| 37. | Free Soil | 4.8% | 1.7%(+3.06)#37 | 2.1%(+2.70)#1,677 |
| 38. | New Era | 4.7% | 1.7%(+2.96)#38 | 2.1%(+2.60)#1,746 |
| 39. | East Grand Rapids | 4.6% | 1.7%(+2.91)#39 | 2.1%(+2.55)#1,775 |
| 40. | Northport | 4.6% | 1.7%(+2.87)#40 | 2.1%(+2.51)#1,801 |
| 41. | Chelsea | 4.5% | 1.7%(+2.78)#41 | 2.1%(+2.43)#1,868 |
| 42. | Hillsdale | 4.5% | 1.7%(+2.76)#42 | 2.1%(+2.40)#1,882 |
| 43. | Chatham | 4.4% | 1.7%(+2.74)#43 | 2.1%(+2.38)#1,894 |
| 44. | Swartz Creek | 4.4% | 1.7%(+2.71)#44 | 2.1%(+2.35)#1,912 |
| 45. | Brownlee Park | 4.4% | 1.7%(+2.69)#45 | 2.1%(+2.33)#1,940 |
| 46. | Hudsonville | 4.4% | 1.7%(+2.68)#46 | 2.1%(+2.32)#1,943 |
| 47. | Mass | 4.3% | 1.7%(+2.58)#47 | 2.1%(+2.22)#2,006 |
| 48. | Traverse City | 4.3% | 1.7%(+2.57)#48 | 2.1%(+2.21)#2,019 |
| 49. | Weidman | 4.3% | 1.7%(+2.56)#49 | 2.1%(+2.20)#2,022 |
| 50. | Bay Port | 4.2% | 1.7%(+2.53)#50 | 2.1%(+2.18)#2,044 |
| 51. | St Joseph | 4.2% | 1.7%(+2.50)#51 | 2.1%(+2.14)#2,081 |
| 52. | Royal Oak | 4.1% | 1.7%(+2.44)#52 | 2.1%(+2.08)#2,135 |
| 53. | Ida | 4.1% | 1.7%(+2.43)#53 | 2.1%(+2.07)#2,142 |
| 54. | Spring Arbor | 4.1% | 1.7%(+2.42)#54 | 2.1%(+2.06)#2,154 |
| 55. | Hopkins | 4.1% | 1.7%(+2.40)#55 | 2.1%(+2.04)#2,168 |
| 56. | Scotts | 4.1% | 1.7%(+2.38)#56 | 2.1%(+2.02)#2,184 |
| 57. | Trowbridge Park | 4.1% | 1.7%(+2.35)#57 | 2.1%(+1.99)#2,213 |
| 58. | Olivet | 4.0% | 1.7%(+2.32)#58 | 2.1%(+1.96)#2,249 |
| 59. | Bridgman | 4.0% | 1.7%(+2.31)#59 | 2.1%(+1.95)#2,252 |
| 60. | Three Oaks | 4.0% | 1.7%(+2.29)#60 | 2.1%(+1.93)#2,281 |
| 61. | Franklin | 4.0% | 1.7%(+2.28)#61 | 2.1%(+1.92)#2,293 |
| 62. | Oscoda | 3.9% | 1.7%(+2.19)#62 | 2.1%(+1.84)#2,370 |
| 63. | Ironton | 3.8% | 1.7%(+2.14)#63 | 2.1%(+1.79)#2,417 |
| 64. | Indian River | 3.8% | 1.7%(+2.10)#64 | 2.1%(+1.74)#2,465 |
| 65. | Paw Paw Lake | 3.8% | 1.7%(+2.07)#65 | 2.1%(+1.71)#2,514 |
| 66. | Mesick | 3.8% | 1.7%(+2.06)#66 | 2.1%(+1.70)#2,526 |
| 67. | Bingham Farms | 3.7% | 1.7%(+2.02)#67 | 2.1%(+1.66)#2,576 |
| 68. | Berkley | 3.7% | 1.7%(+2.00)#68 | 2.1%(+1.64)#2,596 |
| 69. | Luther | 3.7% | 1.7%(+2.00)#69 | 2.1%(+1.64)#2,605 |
| 70. | Wixom | 3.6% | 1.7%(+1.93)#70 | 2.1%(+1.57)#2,680 |
| 71. | Wacousta | 3.6% | 1.7%(+1.88)#71 | 2.1%(+1.52)#2,738 |
| 72. | Clawson | 3.5% | 1.7%(+1.83)#72 | 2.1%(+1.47)#2,820 |
| 73. | Beverly Hills | 3.5% | 1.7%(+1.82)#73 | 2.1%(+1.46)#2,824 |
| 74. | Ypsilanti | 3.5% | 1.7%(+1.82)#74 | 2.1%(+1.46)#2,826 |
| 75. | East Lansing | 3.5% | 1.7%(+1.81)#75 | 2.1%(+1.45)#2,836 |
| 76. | Grosse Pointe Woods | 3.5% | 1.7%(+1.81)#76 | 2.1%(+1.45)#2,838 |
| 77. | Ann Arbor | 3.5% | 1.7%(+1.81)#77 | 2.1%(+1.45)#2,839 |
| 78. | Harbor Springs | 3.5% | 1.7%(+1.81)#78 | 2.1%(+1.45)#2,844 |
| 79. | Williamston | 3.4% | 1.7%(+1.67)#79 | 2.1%(+1.31)#3,045 |
| 80. | Grand Beach | 3.4% | 1.7%(+1.66)#80 | 2.1%(+1.30)#3,051 |
| 81. | Ruby | 3.4% | 1.7%(+1.65)#81 | 2.1%(+1.29)#3,058 |
| 82. | Berrien Springs | 3.3% | 1.7%(+1.64)#82 | 2.1%(+1.29)#3,061 |
| 83. | Grosse Pointe Park | 3.3% | 1.7%(+1.63)#83 | 2.1%(+1.28)#3,085 |
| 84. | Dorr | 3.3% | 1.7%(+1.62)#84 | 2.1%(+1.26)#3,113 |
| 85. | Atlanta | 3.3% | 1.7%(+1.61)#85 | 2.1%(+1.25)#3,123 |
| 86. | Bloomfield Hills | 3.3% | 1.7%(+1.57)#86 | 2.1%(+1.21)#3,203 |
| 87. | St Ignace | 3.2% | 1.7%(+1.53)#87 | 2.1%(+1.17)#3,282 |
| 88. | Tower | 3.2% | 1.7%(+1.50)#88 | 2.1%(+1.14)#3,342 |
| 89. | Hazel Park | 3.1% | 1.7%(+1.44)#89 | 2.1%(+1.08)#3,445 |
| 90. | Dollar Bay | 3.1% | 1.7%(+1.43)#90 | 2.1%(+1.07)#3,468 |
| 91. | Coopersville | 3.1% | 1.7%(+1.42)#91 | 2.1%(+1.06)#3,490 |
| 92. | Grosse Pointe | 3.1% | 1.7%(+1.39)#92 | 2.1%(+1.03)#3,532 |
| 93. | Midland | 3.1% | 1.7%(+1.37)#93 | 2.1%(+1.01)#3,579 |
| 94. | Cheboygan | 3.0% | 1.7%(+1.32)#94 | 2.1%(+0.959)#3,672 |
| 95. | Sault Ste Marie | 3.0% | 1.7%(+1.26)#95 | 2.1%(+0.900)#3,786 |
| 96. | Sturgis | 3.0% | 1.7%(+1.25)#96 | 2.1%(+0.891)#3,809 |
| 97. | Oak Park | 2.9% | 1.7%(+1.23)#97 | 2.1%(+0.870)#3,855 |
| 98. | Edmore | 2.9% | 1.7%(+1.22)#98 | 2.1%(+0.864)#3,863 |
| 99. | Northville | 2.9% | 1.7%(+1.18)#99 | 2.1%(+0.822)#3,963 |
| 100. | Marquette | 2.8% | 1.7%(+1.15)#100 | 2.1%(+0.789)#4,049 |
Common Questions
What are the Top 10 Cities with the Highest Percentage of Population Employed in Arts, Media & Entertainment in Michigan?
Top 10 Cities with the Highest Percentage of Population Employed in Arts, Media & Entertainment in Michigan are:
#1
30.0%
#2
23.0%
#3
15.0%
#4
14.3%
#5
13.6%
#6
10.7%
#7
9.5%
#8
7.7%
#9
7.4%
#10
7.4%
What city has the Highest Percentage of Population Employed in Arts, Media & Entertainment in Michigan?
Cedar has the Highest Percentage of Population Employed in Arts, Media & Entertainment in Michigan with 30.0%.
What is the Percentage of Population Employed in Arts, Media & Entertainment in the State of Michigan?
Percentage of Population Employed in Arts, Media & Entertainment in Michigan is 1.7%.
What is the Percentage of Population Employed in Arts, Media & Entertainment in the United States?
Percentage of Population Employed in Arts, Media & Entertainment in the United States is 2.1%.