Cities with the Highest Percentage of Population Employed in Arts, Media & Entertainment in Virginia
RELATED REPORTS & OPTIONS
Arts, Media & Entertainment
Virginia
Compare Cities
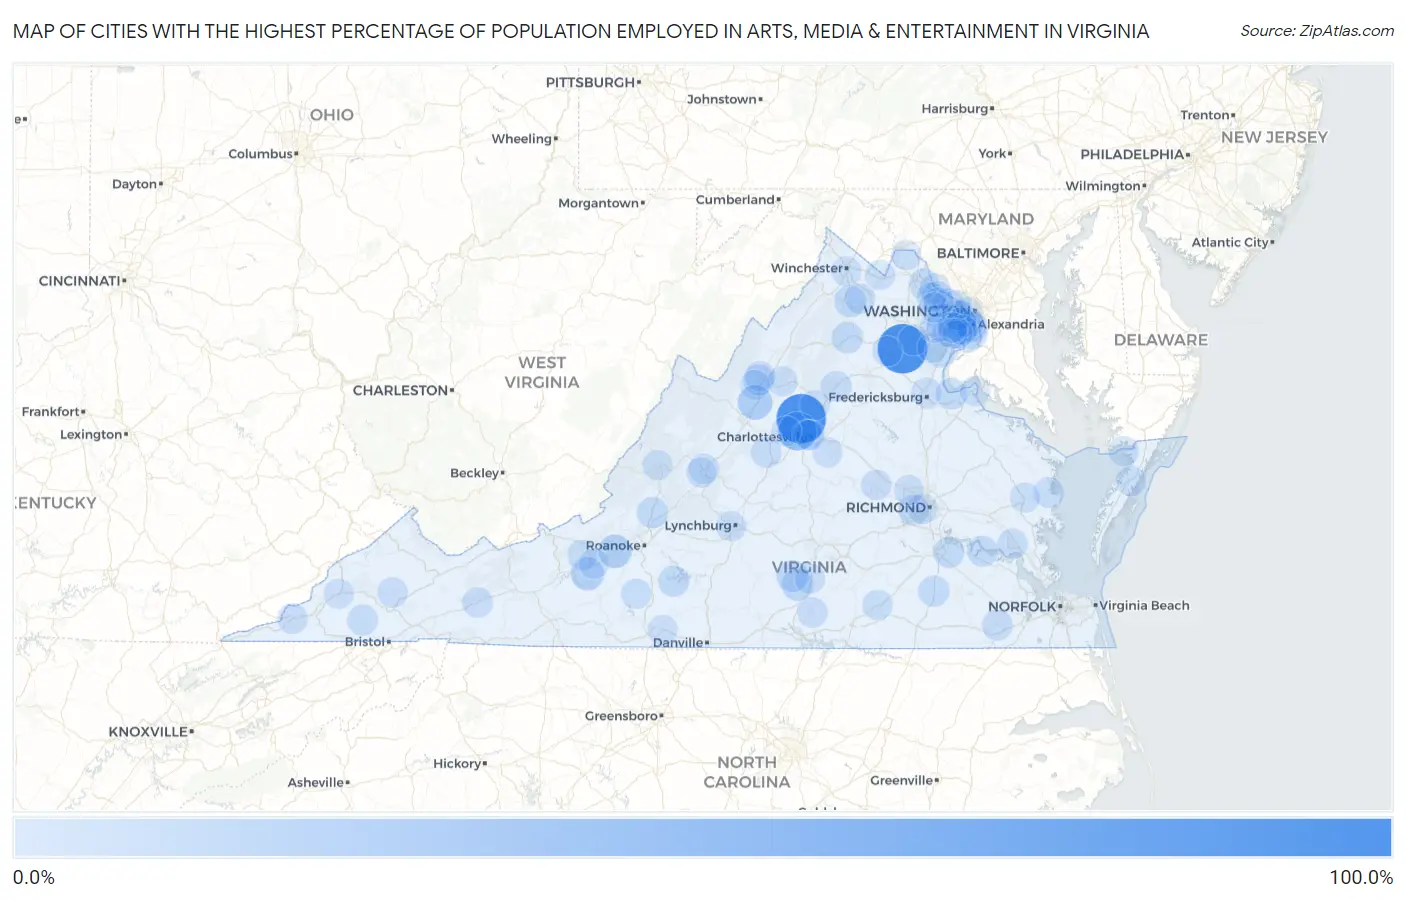
Map of Cities with the Highest Percentage of Population Employed in Arts, Media & Entertainment in Virginia
0.0%
100.0%
Cities with the Highest Percentage of Population Employed in Arts, Media & Entertainment in Virginia
| City | % Employed | vs State | vs National | |
| 1. | Free Union | 100.0% | 2.1%(+97.9)#1 | 2.1%(+97.9)#1 |
| 2. | Calverton | 100.0% | 2.1%(+97.9)#2 | 2.1%(+97.9)#3 |
| 3. | Aldie | 64.3% | 2.1%(+62.2)#3 | 2.1%(+62.2)#12 |
| 4. | Ivy | 44.3% | 2.1%(+42.2)#4 | 2.1%(+42.2)#26 |
| 5. | Mount Sidney | 23.8% | 2.1%(+21.8)#5 | 2.1%(+21.8)#76 |
| 6. | Lafayette | 18.4% | 2.1%(+16.4)#6 | 2.1%(+16.4)#123 |
| 7. | Riner | 18.0% | 2.1%(+15.9)#7 | 2.1%(+15.9)#127 |
| 8. | Great Falls Crossing | 17.1% | 2.1%(+15.0)#8 | 2.1%(+15.0)#139 |
| 9. | Moneta | 16.9% | 2.1%(+14.8)#9 | 2.1%(+14.8)#145 |
| 10. | Shenandoah Shores | 10.9% | 2.1%(+8.79)#10 | 2.1%(+8.80)#333 |
| 11. | Drakes Branch | 10.5% | 2.1%(+8.46)#11 | 2.1%(+8.47)#352 |
| 12. | Charlotte Court House | 10.5% | 2.1%(+8.42)#12 | 2.1%(+8.43)#353 |
| 13. | Fincastle | 9.3% | 2.1%(+7.21)#13 | 2.1%(+7.22)#441 |
| 14. | Washington | 8.8% | 2.1%(+6.75)#14 | 2.1%(+6.76)#483 |
| 15. | Fairview Beach | 8.6% | 2.1%(+6.56)#15 | 2.1%(+6.57)#503 |
| 16. | Stony Creek | 7.8% | 2.1%(+5.76)#16 | 2.1%(+5.77)#618 |
| 17. | Dinwiddie | 7.8% | 2.1%(+5.74)#17 | 2.1%(+5.75)#620 |
| 18. | Ravensworth | 7.8% | 2.1%(+5.69)#18 | 2.1%(+5.70)#629 |
| 19. | Union Hall | 7.6% | 2.1%(+5.50)#19 | 2.1%(+5.51)#671 |
| 20. | Prince George | 7.2% | 2.1%(+5.10)#20 | 2.1%(+5.11)#753 |
| 21. | Claremont | 7.1% | 2.1%(+5.07)#21 | 2.1%(+5.08)#759 |
| 22. | Dayton | 6.5% | 2.1%(+4.46)#22 | 2.1%(+4.47)#900 |
| 23. | Carrsville | 6.2% | 2.1%(+4.18)#23 | 2.1%(+4.19)#978 |
| 24. | Nellysford | 6.2% | 2.1%(+4.12)#24 | 2.1%(+4.13)#994 |
| 25. | Nokesville | 6.2% | 2.1%(+4.11)#25 | 2.1%(+4.12)#998 |
| 26. | Nickelsville | 6.1% | 2.1%(+4.03)#26 | 2.1%(+4.04)#1,019 |
| 27. | Bon Air | 6.0% | 2.1%(+3.89)#27 | 2.1%(+3.90)#1,069 |
| 28. | Madison | 5.6% | 2.1%(+3.58)#28 | 2.1%(+3.59)#1,183 |
| 29. | Franconia | 5.5% | 2.1%(+3.41)#29 | 2.1%(+3.42)#1,272 |
| 30. | Cleveland | 5.4% | 2.1%(+3.31)#30 | 2.1%(+3.32)#1,324 |
| 31. | Belle Haven | 5.4% | 2.1%(+3.30)#31 | 2.1%(+3.31)#1,327 |
| 32. | The University Of Virginia's College At Wise | 5.3% | 2.1%(+3.22)#32 | 2.1%(+3.23)#1,365 |
| 33. | White Stone | 5.0% | 2.1%(+2.96)#33 | 2.1%(+2.97)#1,497 |
| 34. | Rio | 5.0% | 2.1%(+2.94)#34 | 2.1%(+2.95)#1,503 |
| 35. | Goochland | 4.9% | 2.1%(+2.83)#35 | 2.1%(+2.84)#1,577 |
| 36. | Cascades | 4.8% | 2.1%(+2.78)#36 | 2.1%(+2.79)#1,614 |
| 37. | Pennington Gap | 4.8% | 2.1%(+2.76)#37 | 2.1%(+2.77)#1,640 |
| 38. | Fort Hunt | 4.8% | 2.1%(+2.75)#38 | 2.1%(+2.76)#1,644 |
| 39. | Shenandoah Farms | 4.8% | 2.1%(+2.73)#39 | 2.1%(+2.74)#1,651 |
| 40. | Dranesville | 4.7% | 2.1%(+2.64)#40 | 2.1%(+2.65)#1,706 |
| 41. | Wolf Trap | 4.6% | 2.1%(+2.56)#41 | 2.1%(+2.57)#1,765 |
| 42. | Lake Barcroft | 4.6% | 2.1%(+2.56)#42 | 2.1%(+2.57)#1,767 |
| 43. | Atkins | 4.6% | 2.1%(+2.55)#43 | 2.1%(+2.56)#1,773 |
| 44. | Arlington | 4.6% | 2.1%(+2.51)#44 | 2.1%(+2.52)#1,797 |
| 45. | George Mason | 4.5% | 2.1%(+2.44)#45 | 2.1%(+2.45)#1,848 |
| 46. | Independent Hill | 4.5% | 2.1%(+2.43)#46 | 2.1%(+2.44)#1,854 |
| 47. | East Lexington | 4.5% | 2.1%(+2.43)#47 | 2.1%(+2.44)#1,860 |
| 48. | Belmont Estates | 4.4% | 2.1%(+2.34)#48 | 2.1%(+2.35)#1,917 |
| 49. | Chase City | 4.4% | 2.1%(+2.30)#49 | 2.1%(+2.31)#1,954 |
| 50. | Clifton | 4.3% | 2.1%(+2.28)#50 | 2.1%(+2.29)#1,968 |
| 51. | Williamsburg | 4.3% | 2.1%(+2.18)#51 | 2.1%(+2.19)#2,032 |
| 52. | University Of Virginia | 4.2% | 2.1%(+2.12)#52 | 2.1%(+2.13)#2,088 |
| 53. | South Run | 4.2% | 2.1%(+2.12)#53 | 2.1%(+2.12)#2,095 |
| 54. | Huntington | 4.2% | 2.1%(+2.09)#54 | 2.1%(+2.10)#2,119 |
| 55. | Lansdowne | 4.1% | 2.1%(+2.07)#55 | 2.1%(+2.08)#2,134 |
| 56. | Mount Vernon | 4.1% | 2.1%(+2.01)#56 | 2.1%(+2.02)#2,188 |
| 57. | Fairfield | 4.0% | 2.1%(+1.97)#57 | 2.1%(+1.98)#2,224 |
| 58. | Saxis | 4.0% | 2.1%(+1.97)#58 | 2.1%(+1.98)#2,226 |
| 59. | Alexandria | 3.9% | 2.1%(+1.85)#59 | 2.1%(+1.86)#2,350 |
| 60. | Union Mill | 3.9% | 2.1%(+1.81)#60 | 2.1%(+1.82)#2,384 |
| 61. | Alberta | 3.8% | 2.1%(+1.78)#61 | 2.1%(+1.79)#2,415 |
| 62. | Fairfax Station | 3.8% | 2.1%(+1.75)#62 | 2.1%(+1.76)#2,440 |
| 63. | West Falls Church | 3.8% | 2.1%(+1.75)#63 | 2.1%(+1.76)#2,442 |
| 64. | Keezletown | 3.8% | 2.1%(+1.74)#64 | 2.1%(+1.75)#2,455 |
| 65. | Ferrum | 3.8% | 2.1%(+1.71)#65 | 2.1%(+1.72)#2,492 |
| 66. | Lincolnia | 3.7% | 2.1%(+1.68)#66 | 2.1%(+1.69)#2,542 |
| 67. | Winchester | 3.7% | 2.1%(+1.63)#67 | 2.1%(+1.64)#2,595 |
| 68. | Navy | 3.6% | 2.1%(+1.54)#68 | 2.1%(+1.55)#2,703 |
| 69. | Norton | 3.6% | 2.1%(+1.52)#69 | 2.1%(+1.53)#2,728 |
| 70. | Kingstowne | 3.6% | 2.1%(+1.51)#70 | 2.1%(+1.52)#2,735 |
| 71. | Montclair | 3.6% | 2.1%(+1.49)#71 | 2.1%(+1.50)#2,769 |
| 72. | Prices Fork | 3.5% | 2.1%(+1.46)#72 | 2.1%(+1.47)#2,813 |
| 73. | Massanutten | 3.5% | 2.1%(+1.42)#73 | 2.1%(+1.43)#2,865 |
| 74. | Keysville | 3.5% | 2.1%(+1.41)#74 | 2.1%(+1.42)#2,880 |
| 75. | Dahlgren Center | 3.4% | 2.1%(+1.35)#75 | 2.1%(+1.36)#2,956 |
| 76. | Chatmoss | 3.4% | 2.1%(+1.34)#76 | 2.1%(+1.35)#2,967 |
| 77. | Mclean | 3.4% | 2.1%(+1.33)#77 | 2.1%(+1.34)#2,984 |
| 78. | Falmouth | 3.4% | 2.1%(+1.33)#78 | 2.1%(+1.34)#2,985 |
| 79. | Charlottesville | 3.4% | 2.1%(+1.30)#79 | 2.1%(+1.31)#3,040 |
| 80. | Opal | 3.4% | 2.1%(+1.29)#80 | 2.1%(+1.30)#3,054 |
| 81. | Shenandoah Retreat | 3.4% | 2.1%(+1.28)#81 | 2.1%(+1.29)#3,059 |
| 82. | Lynchburg | 3.3% | 2.1%(+1.26)#82 | 2.1%(+1.27)#3,107 |
| 83. | Newington | 3.3% | 2.1%(+1.25)#83 | 2.1%(+1.26)#3,114 |
| 84. | Richmond | 3.3% | 2.1%(+1.25)#84 | 2.1%(+1.26)#3,120 |
| 85. | Reston | 3.3% | 2.1%(+1.19)#85 | 2.1%(+1.20)#3,224 |
| 86. | Lake Monticello | 3.2% | 2.1%(+1.18)#86 | 2.1%(+1.19)#3,249 |
| 87. | Lexington | 3.2% | 2.1%(+1.17)#87 | 2.1%(+1.18)#3,260 |
| 88. | Oak Grove | 3.2% | 2.1%(+1.10)#88 | 2.1%(+1.11)#3,392 |
| 89. | Newington Forest | 3.2% | 2.1%(+1.09)#89 | 2.1%(+1.09)#3,428 |
| 90. | Saluda | 3.2% | 2.1%(+1.08)#90 | 2.1%(+1.09)#3,435 |
| 91. | Bridgewater | 3.1% | 2.1%(+1.07)#91 | 2.1%(+1.08)#3,461 |
| 92. | Crozet | 3.1% | 2.1%(+1.05)#92 | 2.1%(+1.06)#3,489 |
| 93. | Franklin Farm | 3.1% | 2.1%(+1.04)#93 | 2.1%(+1.05)#3,503 |
| 94. | Accomac | 3.1% | 2.1%(+1.02)#94 | 2.1%(+1.03)#3,536 |
| 95. | Twin Lakes | 3.1% | 2.1%(+1.01)#95 | 2.1%(+1.02)#3,551 |
| 96. | Lovettsville | 3.1% | 2.1%(+0.990)#96 | 2.1%(+1.000)#3,597 |
| 97. | Clifton Forge | 3.1% | 2.1%(+0.986)#97 | 2.1%(+0.996)#3,601 |
| 98. | Christiansburg | 3.0% | 2.1%(+0.971)#98 | 2.1%(+0.980)#3,632 |
| 99. | Short Pump | 3.0% | 2.1%(+0.963)#99 | 2.1%(+0.973)#3,644 |
| 100. | West Springfield | 3.0% | 2.1%(+0.899)#100 | 2.1%(+0.909)#3,771 |
Common Questions
What are the Top 10 Cities with the Highest Percentage of Population Employed in Arts, Media & Entertainment in Virginia?
Top 10 Cities with the Highest Percentage of Population Employed in Arts, Media & Entertainment in Virginia are:
#1
100.0%
#2
100.0%
#3
44.3%
#4
23.8%
#5
18.4%
#6
18.0%
#7
10.9%
#8
10.5%
#9
10.5%
#10
9.3%
What city has the Highest Percentage of Population Employed in Arts, Media & Entertainment in Virginia?
Free Union has the Highest Percentage of Population Employed in Arts, Media & Entertainment in Virginia with 100.0%.
What is the Percentage of Population Employed in Arts, Media & Entertainment in the State of Virginia?
Percentage of Population Employed in Arts, Media & Entertainment in Virginia is 2.1%.
What is the Percentage of Population Employed in Arts, Media & Entertainment in the United States?
Percentage of Population Employed in Arts, Media & Entertainment in the United States is 2.1%.