Cities with the Highest Percentage of Population Employed in Arts, Media & Entertainment in the United States
RELATED REPORTS & OPTIONS
Arts, Media & Entertainment
United States
Compare Cities
Map of Cities with the Highest Percentage of Population Employed in Arts, Media & Entertainment in the United States
0.0%
100.0%
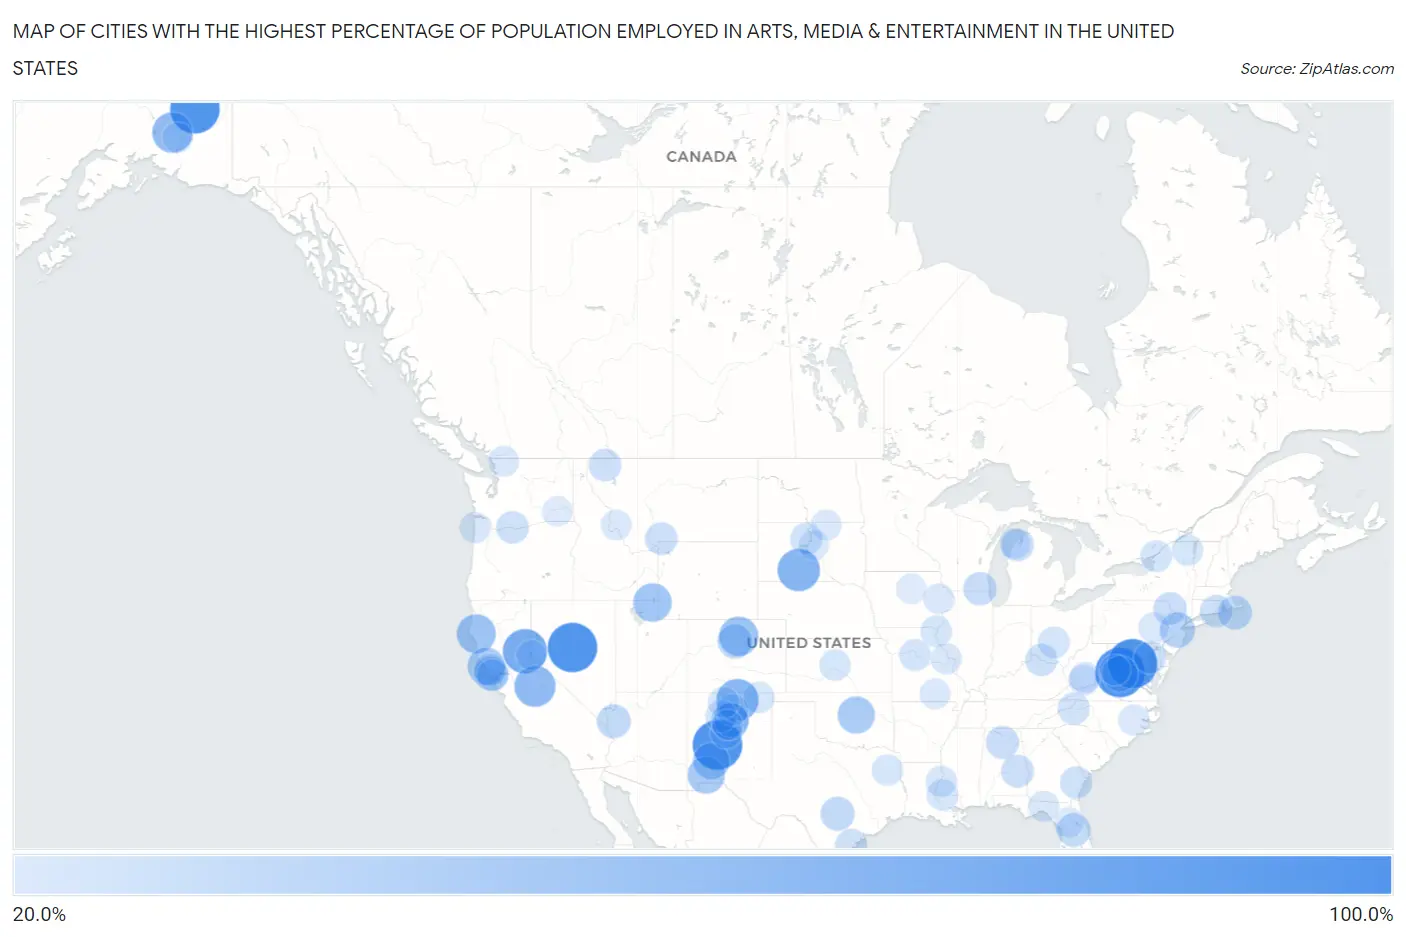
Cities with the Highest Percentage of Population Employed in Arts, Media & Entertainment in the United States
| City | % Employed | vs State | vs National | |
| 1. | Free Union | 100.0% | 2.1% (+97.9)#1 | 2.1% (+97.9)#1 |
| 2. | Slana | 100.0% | 1.7% (+98.3)#1 | 2.1% (+97.9)#2 |
| 3. | Calverton | 100.0% | 2.1% (+97.9)#2 | 2.1% (+97.9)#3 |
| 4. | Luis Lopez | 100.0% | 1.9% (+98.1)#1 | 2.1% (+97.9)#4 |
| 5. | Stoneville | 100.0% | 1.1% (+98.9)#1 | 2.1% (+97.9)#5 |
| 6. | Pheba | 100.0% | 1.1% (+98.9)#2 | 2.1% (+97.9)#6 |
| 7. | Austin | 100.0% | 2.1% (+97.9)#1 | 2.1% (+97.9)#7 |
| 8. | Soda Springs | 77.8% | 3.0% (+74.8)#1 | 2.1% (+75.7)#8 |
| 9. | Corn Creek | 70.0% | 1.5% (+68.5)#1 | 2.1% (+67.9)#9 |
| 10. | Taos Ski Valley | 68.9% | 1.9% (+67.0)#2 | 2.1% (+66.8)#10 |
| 11. | Nipinnawasee | 64.8% | 3.0% (+61.9)#2 | 2.1% (+62.8)#11 |
| 12. | Aldie | 64.3% | 2.1% (+62.2)#3 | 2.1% (+62.2)#12 |
| 13. | Willow Creek | 62.5% | 1.7% (+60.8)#2 | 2.1% (+60.4)#13 |
| 14. | Glendale | 57.1% | 2.4% (+54.7)#1 | 2.1% (+55.1)#14 |
| 15. | Myers Flat | 56.0% | 3.0% (+53.0)#3 | 2.1% (+53.9)#15 |
| 16. | Garden | 53.8% | 2.3% (+51.5)#1 | 2.1% (+51.8)#16 |
| 17. | Lewis | 51.3% | 1.4% (+49.9)#1 | 2.1% (+49.2)#17 |
| 18. | Jenner | 50.0% | 3.0% (+47.0)#4 | 2.1% (+47.9)#18 |
| 19. | Dewey | 50.0% | 2.0% (+48.0)#1 | 2.1% (+47.9)#19 |
| 20. | Galisteo | 49.2% | 1.9% (+47.4)#3 | 2.1% (+47.2)#20 |
| 21. | Hillside Colony | 49.2% | 2.0% (+47.2)#2 | 2.1% (+47.1)#21 |
| 22. | Pecan Park | 49.1% | 1.9% (+47.2)#4 | 2.1% (+47.0)#22 |
| 23. | Fallis | 48.4% | 1.4% (+47.0)#1 | 2.1% (+46.3)#23 |
| 24. | Las Palomas | 47.2% | 1.9% (+45.4)#5 | 2.1% (+45.2)#24 |
| 25. | Morris Chapel | 45.3% | 1.9% (+43.3)#1 | 2.1% (+43.2)#25 |
| 26. | Ivy | 44.3% | 2.1% (+42.2)#4 | 2.1% (+42.2)#26 |
| 27. | Keats | 43.9% | 1.6% (+42.3)#1 | 2.1% (+41.8)#27 |
| 28. | Tow | 42.9% | 1.7% (+41.2)#1 | 2.1% (+40.8)#28 |
| 29. | Pleasant Plains | 40.9% | 2.1% (+38.8)#1 | 2.1% (+38.8)#29 |
| 30. | Point Reyes Station | 38.4% | 3.0% (+35.4)#5 | 2.1% (+36.3)#30 |
| 31. | St Mary S | 38.1% | 2.4% (+35.6)#2 | 2.1% (+36.0)#31 |
| 32. | Lamy | 37.5% | 1.9% (+35.6)#6 | 2.1% (+35.4)#32 |
| 33. | Cornwall | 37.1% | 2.2% (+35.0)#1 | 2.1% (+35.1)#33 |
| 34. | Blue Valley | 36.4% | 2.4% (+33.9)#3 | 2.1% (+34.3)#34 |
| 35. | Edgartown | 35.9% | 2.4% (+33.5)#1 | 2.1% (+33.8)#35 |
| 36. | Chloride | 35.5% | 1.8% (+33.7)#1 | 2.1% (+33.4)#36 |
| 37. | Spring Branch | 35.4% | 1.7% (+33.8)#2 | 2.1% (+33.4)#37 |
| 38. | Zion | 34.5% | 1.5% (+33.0)#1 | 2.1% (+32.4)#38 |
| 39. | Lisbon | 34.4% | 2.0% (+32.5)#1 | 2.1% (+32.4)#39 |
| 40. | Old River | 33.8% | 3.0% (+30.9)#6 | 2.1% (+31.8)#40 |
| 41. | Weston | 33.3% | 2.7% (+30.7)#1 | 2.1% (+31.3)#41 |
| 42. | Springfield | 32.6% | 1.7% (+30.9)#1 | 2.1% (+30.5)#42 |
| 43. | Narrowsburg | 31.9% | 3.3% (+28.6)#1 | 2.1% (+29.8)#43 |
| 44. | West Woodstock | 31.8% | 2.7% (+29.2)#2 | 2.1% (+29.8)#44 |
| 45. | East Point | 31.5% | 1.3% (+30.3)#1 | 2.1% (+29.5)#45 |
| 46. | Franklin | 30.4% | 1.3% (+29.1)#2 | 2.1% (+28.3)#46 |
| 47. | Hopkinton | 30.1% | 2.4% (+27.7)#1 | 2.1% (+28.0)#47 |
| 48. | Cedar | 30.0% | 1.7% (+28.3)#1 | 2.1% (+27.9)#48 |
| 49. | Stryker | 30.0% | 2.0% (+28.0)#3 | 2.1% (+27.9)#49 |
| 50. | Tomales | 29.8% | 3.0% (+26.8)#7 | 2.1% (+27.7)#50 |
| 51. | Corwin Springs | 29.7% | 2.0% (+27.7)#4 | 2.1% (+27.6)#51 |
| 52. | Lyle | 29.2% | 2.1% (+27.1)#1 | 2.1% (+27.2)#52 |
| 53. | Highland Beach | 29.0% | 2.2% (+26.8)#1 | 2.1% (+27.0)#53 |
| 54. | Chilo | 28.6% | 1.6% (+27.0)#1 | 2.1% (+26.5)#54 |
| 55. | La Paloma Addition | 28.4% | 1.7% (+26.8)#3 | 2.1% (+26.3)#55 |
| 56. | Gumbranch | 28.4% | 2.0% (+26.4)#1 | 2.1% (+26.3)#56 |
| 57. | Sugar Mountain | 27.9% | 1.7% (+26.2)#1 | 2.1% (+25.9)#57 |
| 58. | Tajique | 27.5% | 1.9% (+25.7)#7 | 2.1% (+25.5)#58 |
| 59. | La Plant | 27.3% | 1.5% (+25.8)#2 | 2.1% (+25.2)#59 |
| 60. | Truchas | 27.0% | 1.9% (+25.2)#8 | 2.1% (+25.0)#60 |
| 61. | Ponderosa | 26.9% | 1.9% (+25.0)#9 | 2.1% (+24.8)#61 |
| 62. | Lucerne | 26.8% | 1.4% (+25.3)#2 | 2.1% (+24.7)#62 |
| 63. | Arrow Rock | 26.7% | 1.7% (+25.0)#1 | 2.1% (+24.6)#63 |
| 64. | Derby | 26.4% | 1.6% (+24.9)#2 | 2.1% (+24.4)#64 |
| 65. | San Geronimo | 26.1% | 3.0% (+23.1)#8 | 2.1% (+24.0)#65 |
| 66. | Thousand Island Park | 25.7% | 3.3% (+22.5)#2 | 2.1% (+23.7)#66 |
| 67. | Centreville | 25.4% | 1.1% (+24.3)#3 | 2.1% (+23.4)#67 |
| 68. | Canjilon | 25.0% | 1.9% (+23.1)#10 | 2.1% (+22.9)#68 |
| 69. | Odin | 25.0% | 1.6% (+23.4)#2 | 2.1% (+22.9)#69 |
| 70. | Capulin | 25.0% | 1.9% (+23.1)#11 | 2.1% (+22.9)#70 |
| 71. | Alexandria | 25.0% | 1.7% (+23.3)#2 | 2.1% (+22.9)#71 |
| 72. | Union Grove | 24.8% | 1.7% (+23.2)#4 | 2.1% (+22.8)#72 |
| 73. | Redford | 24.7% | 3.3% (+21.4)#3 | 2.1% (+22.6)#73 |
| 74. | Waukeenah | 24.1% | 2.0% (+22.1)#2 | 2.1% (+22.0)#74 |
| 75. | Manzanita | 24.0% | 2.5% (+21.5)#1 | 2.1% (+21.9)#75 |
| 76. | Mount Sidney | 23.8% | 2.1% (+21.8)#5 | 2.1% (+21.8)#76 |
| 77. | Alcorn State University | 23.7% | 1.1% (+22.6)#4 | 2.1% (+21.7)#77 |
| 78. | Prince | 23.5% | 1.2% (+22.3)#1 | 2.1% (+21.5)#78 |
| 79. | Chain Of Rocks | 23.4% | 1.7% (+21.7)#3 | 2.1% (+21.3)#79 |
| 80. | Cedar Grove | 23.2% | 1.9% (+21.3)#12 | 2.1% (+21.1)#80 |
| 81. | Glen Arbor | 23.0% | 1.7% (+21.3)#2 | 2.1% (+20.9)#81 |
| 82. | Maury | 22.9% | 1.7% (+21.2)#2 | 2.1% (+20.9)#82 |
| 83. | Blairsville | 22.9% | 1.4% (+21.4)#3 | 2.1% (+20.8)#83 |
| 84. | Glacier | 22.8% | 2.1% (+20.7)#2 | 2.1% (+20.8)#84 |
| 85. | Summit Station | 22.6% | 1.8% (+20.9)#1 | 2.1% (+20.6)#85 |
| 86. | Bache | 22.2% | 1.4% (+20.8)#2 | 2.1% (+20.2)#86 |
| 87. | Montier | 22.2% | 1.7% (+20.6)#4 | 2.1% (+20.2)#87 |
| 88. | Long Lake | 22.2% | 1.5% (+20.8)#3 | 2.1% (+20.2)#88 |
| 89. | Longview | 22.2% | 1.1% (+21.0)#5 | 2.1% (+20.1)#89 |
| 90. | Beaver | 22.1% | 1.2% (+20.9)#2 | 2.1% (+20.1)#90 |
| 91. | Stone City | 21.8% | 1.5% (+20.3)#1 | 2.1% (+19.8)#91 |
| 92. | Kenny Lake | 21.7% | 1.7% (+20.1)#3 | 2.1% (+19.7)#92 |
| 93. | Sula | 21.7% | 2.0% (+19.8)#5 | 2.1% (+19.7)#93 |
| 94. | Brimfield | 21.7% | 1.4% (+20.3)#4 | 2.1% (+19.6)#94 |
| 95. | Bradford | 21.4% | 1.5% (+19.9)#2 | 2.1% (+19.4)#95 |
| 96. | Glenbrook | 21.3% | 2.1% (+19.3)#2 | 2.1% (+19.3)#96 |
| 97. | New Haven Cdp Hamilton County | 21.3% | 1.6% (+19.7)#3 | 2.1% (+19.2)#97 |
| 98. | Agar | 21.2% | 1.5% (+19.7)#4 | 2.1% (+19.1)#98 |
| 99. | Reddick | 21.1% | 2.0% (+19.2)#3 | 2.1% (+19.1)#99 |
| 100. | Starbuck | 21.1% | 2.1% (+19.0)#3 | 2.1% (+19.0)#100 |
Common Questions
What are the Top 10 Cities with the Highest Percentage of Population Employed in Arts, Media & Entertainment in the United States?
Top 10 Cities with the Highest Percentage of Population Employed in Arts, Media & Entertainment in the United States are:
#1
100.0%
#2
100.0%
#3
100.0%
#4
100.0%
#5
100.0%
#6
77.8%
#7
70.0%
#8
68.9%
#9
64.8%
#10
62.5%
What city has the Highest Percentage of Population Employed in Arts, Media & Entertainment in the United States?
Free Union has the Highest Percentage of Population Employed in Arts, Media & Entertainment in the United States with 100.0%.
What is the Percentage of Population Employed in Arts, Media & Entertainment in the United States?
Percentage of Population Employed in Arts, Media & Entertainment in the United States is 2.1%.