Cities with the Highest Percentage of Population Employed in Arts, Media & Entertainment in Utah
RELATED REPORTS & OPTIONS
Arts, Media & Entertainment
Utah
Compare Cities
Map of Cities with the Highest Percentage of Population Employed in Arts, Media & Entertainment in Utah
0.0%
60.0%
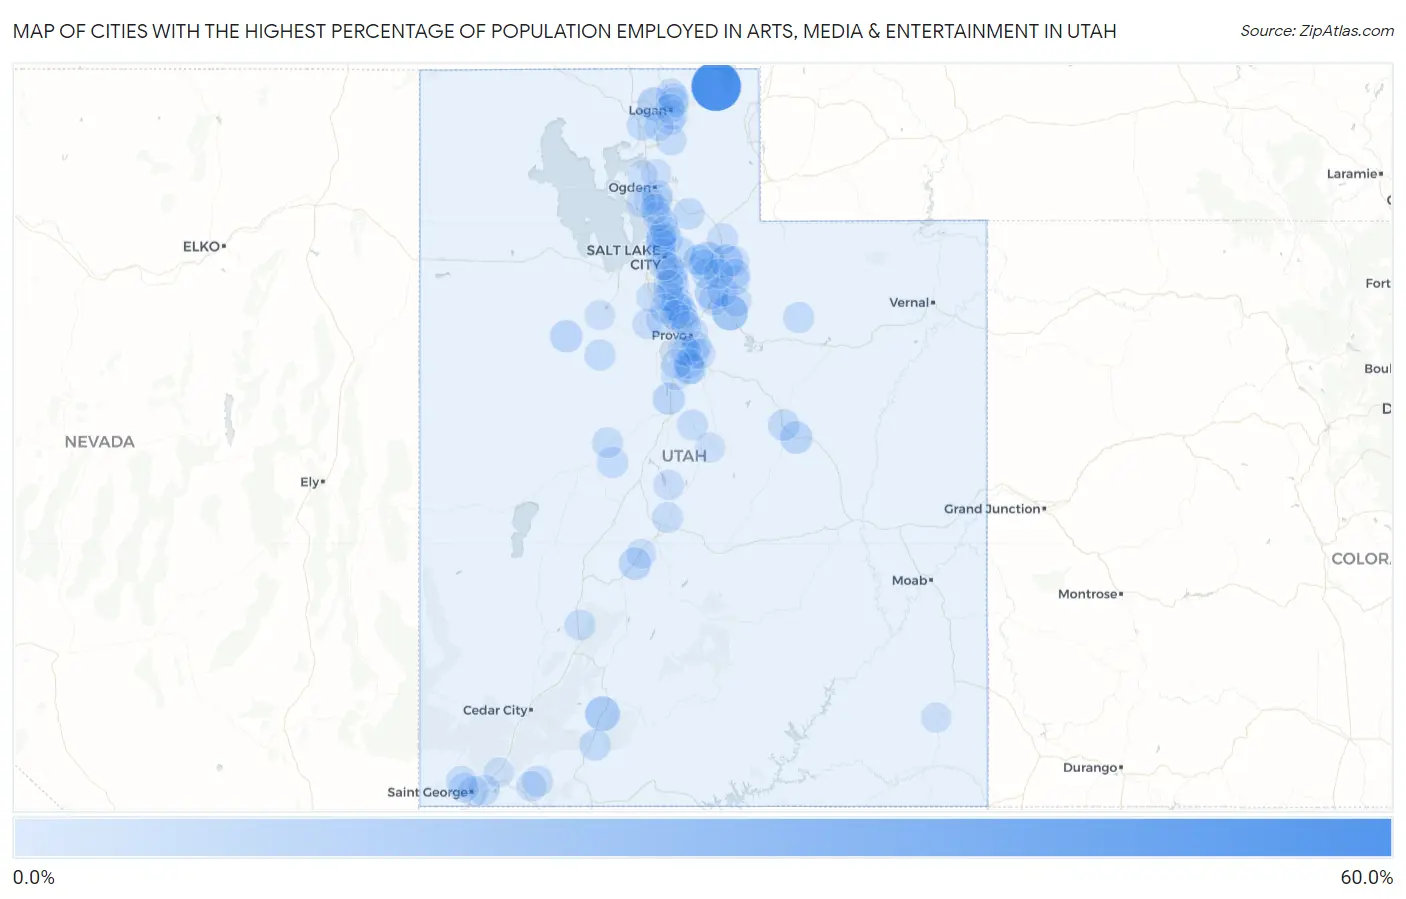
Cities with the Highest Percentage of Population Employed in Arts, Media & Entertainment in Utah
| City | % Employed | vs State | vs National | |
| 1. | Garden | 53.8% | 2.3% (+51.5)#1 | 2.1% (+51.8)#16 |
| 2. | Independence | 16.7% | 2.3% (+14.3)#2 | 2.1% (+14.6)#149 |
| 3. | Hatch | 13.9% | 2.3% (+11.6)#3 | 2.1% (+11.8)#215 |
| 4. | Silver Summit | 12.0% | 2.3% (+9.71)#4 | 2.1% (+9.97)#284 |
| 5. | Midway | 10.3% | 2.3% (+8.01)#5 | 2.1% (+8.27)#360 |
| 6. | Peoa | 10.0% | 2.3% (+7.68)#6 | 2.1% (+7.94)#385 |
| 7. | Peter | 9.3% | 2.3% (+7.00)#7 | 2.1% (+7.26)#436 |
| 8. | Wellington | 8.0% | 2.3% (+5.67)#8 | 2.1% (+5.93)#598 |
| 9. | Dugway | 7.9% | 2.3% (+5.59)#9 | 2.1% (+5.85)#609 |
| 10. | Elsinore | 7.8% | 2.3% (+5.43)#10 | 2.1% (+5.69)#632 |
| 11. | Mona | 7.0% | 2.3% (+4.73)#11 | 2.1% (+4.98)#779 |
| 12. | Emigration Canyon | 6.3% | 2.3% (+4.00)#12 | 2.1% (+4.26)#958 |
| 13. | Carbonville | 5.9% | 2.3% (+3.60)#13 | 2.1% (+3.86)#1,090 |
| 14. | Park City | 5.7% | 2.3% (+3.33)#14 | 2.1% (+3.59)#1,180 |
| 15. | Alton | 5.6% | 2.3% (+3.31)#15 | 2.1% (+3.57)#1,186 |
| 16. | Granite | 5.5% | 2.3% (+3.14)#16 | 2.1% (+3.40)#1,281 |
| 17. | Honeyville | 5.3% | 2.3% (+3.00)#17 | 2.1% (+3.26)#1,354 |
| 18. | Morgan | 5.3% | 2.3% (+2.94)#18 | 2.1% (+3.20)#1,380 |
| 19. | Elk Ridge | 5.2% | 2.3% (+2.91)#19 | 2.1% (+3.17)#1,399 |
| 20. | Snyderville | 4.9% | 2.3% (+2.61)#20 | 2.1% (+2.87)#1,568 |
| 21. | Vernon | 4.8% | 2.3% (+2.50)#21 | 2.1% (+2.76)#1,645 |
| 22. | Oak City | 4.7% | 2.3% (+2.39)#22 | 2.1% (+2.65)#1,708 |
| 23. | Tabiona | 4.7% | 2.3% (+2.37)#23 | 2.1% (+2.63)#1,726 |
| 24. | Summit Park | 4.6% | 2.3% (+2.26)#24 | 2.1% (+2.51)#1,800 |
| 25. | Washington | 4.5% | 2.3% (+2.15)#25 | 2.1% (+2.41)#1,876 |
| 26. | Beaver | 4.2% | 2.3% (+1.90)#26 | 2.1% (+2.16)#2,053 |
| 27. | Hoytsville | 4.2% | 2.3% (+1.90)#27 | 2.1% (+2.16)#2,056 |
| 28. | Provo | 4.2% | 2.3% (+1.90)#28 | 2.1% (+2.16)#2,057 |
| 29. | Fountain Green | 4.2% | 2.3% (+1.85)#29 | 2.1% (+2.11)#2,107 |
| 30. | East Basin | 4.1% | 2.3% (+1.79)#30 | 2.1% (+2.05)#2,162 |
| 31. | Springdale | 4.1% | 2.3% (+1.77)#31 | 2.1% (+2.03)#2,173 |
| 32. | Redmond | 4.1% | 2.3% (+1.76)#32 | 2.1% (+2.02)#2,180 |
| 33. | Lynndyl | 4.0% | 2.3% (+1.68)#33 | 2.1% (+1.94)#2,272 |
| 34. | Avon | 4.0% | 2.3% (+1.66)#34 | 2.1% (+1.92)#2,289 |
| 35. | Ivins | 3.9% | 2.3% (+1.56)#35 | 2.1% (+1.82)#2,382 |
| 36. | Alpine | 3.9% | 2.3% (+1.54)#36 | 2.1% (+1.80)#2,395 |
| 37. | Charleston | 3.6% | 2.3% (+1.31)#37 | 2.1% (+1.57)#2,684 |
| 38. | Bountiful | 3.6% | 2.3% (+1.27)#38 | 2.1% (+1.53)#2,724 |
| 39. | Timber Lakes | 3.6% | 2.3% (+1.24)#39 | 2.1% (+1.50)#2,774 |
| 40. | Pleasant Grove | 3.6% | 2.3% (+1.23)#40 | 2.1% (+1.49)#2,780 |
| 41. | Cedar Hills | 3.6% | 2.3% (+1.23)#41 | 2.1% (+1.49)#2,788 |
| 42. | Heber | 3.5% | 2.3% (+1.23)#42 | 2.1% (+1.49)#2,796 |
| 43. | Salt Lake City | 3.5% | 2.3% (+1.19)#43 | 2.1% (+1.45)#2,837 |
| 44. | Farmington | 3.4% | 2.3% (+1.08)#44 | 2.1% (+1.34)#2,986 |
| 45. | Woodland Hills | 3.4% | 2.3% (+1.03)#45 | 2.1% (+1.29)#3,055 |
| 46. | South Weber | 3.3% | 2.3% (+1.02)#46 | 2.1% (+1.28)#3,082 |
| 47. | Woods Cross | 3.3% | 2.3% (+0.993)#47 | 2.1% (+1.25)#3,124 |
| 48. | Lake Shore | 3.3% | 2.3% (+0.985)#48 | 2.1% (+1.24)#3,142 |
| 49. | Spanish Fork | 3.3% | 2.3% (+0.958)#49 | 2.1% (+1.22)#3,199 |
| 50. | Highland | 3.3% | 2.3% (+0.954)#50 | 2.1% (+1.21)#3,204 |
| 51. | Cottonwood Heights | 3.2% | 2.3% (+0.925)#51 | 2.1% (+1.18)#3,250 |
| 52. | Mapleton | 3.2% | 2.3% (+0.919)#52 | 2.1% (+1.18)#3,265 |
| 53. | Saratoga Springs | 3.2% | 2.3% (+0.857)#53 | 2.1% (+1.12)#3,385 |
| 54. | Fayette | 3.1% | 2.3% (+0.804)#54 | 2.1% (+1.06)#3,479 |
| 55. | Francis | 3.1% | 2.3% (+0.783)#55 | 2.1% (+1.04)#3,514 |
| 56. | Draper | 3.1% | 2.3% (+0.752)#56 | 2.1% (+1.01)#3,571 |
| 57. | South Ogden | 3.0% | 2.3% (+0.724)#57 | 2.1% (+0.984)#3,628 |
| 58. | Hyde Park | 3.0% | 2.3% (+0.678)#58 | 2.1% (+0.938)#3,712 |
| 59. | Oakley | 3.0% | 2.3% (+0.675)#59 | 2.1% (+0.934)#3,719 |
| 60. | Kamas | 3.0% | 2.3% (+0.673)#60 | 2.1% (+0.933)#3,720 |
| 61. | Eagle Mountain | 3.0% | 2.3% (+0.667)#61 | 2.1% (+0.927)#3,731 |
| 62. | North Salt Lake | 3.0% | 2.3% (+0.666)#62 | 2.1% (+0.926)#3,734 |
| 63. | Rockville | 2.9% | 2.3% (+0.620)#63 | 2.1% (+0.880)#3,838 |
| 64. | St George | 2.9% | 2.3% (+0.589)#64 | 2.1% (+0.849)#3,896 |
| 65. | Holladay | 2.8% | 2.3% (+0.478)#65 | 2.1% (+0.738)#4,176 |
| 66. | Lindon | 2.8% | 2.3% (+0.445)#66 | 2.1% (+0.705)#4,247 |
| 67. | Smithfield | 2.8% | 2.3% (+0.444)#67 | 2.1% (+0.703)#4,252 |
| 68. | West Bountiful | 2.7% | 2.3% (+0.399)#68 | 2.1% (+0.659)#4,371 |
| 69. | Kaysville | 2.7% | 2.3% (+0.367)#69 | 2.1% (+0.627)#4,453 |
| 70. | Springville | 2.7% | 2.3% (+0.355)#70 | 2.1% (+0.615)#4,484 |
| 71. | Millcreek | 2.7% | 2.3% (+0.354)#71 | 2.1% (+0.614)#4,487 |
| 72. | Santaquin | 2.6% | 2.3% (+0.324)#72 | 2.1% (+0.583)#4,565 |
| 73. | Salem | 2.6% | 2.3% (+0.318)#73 | 2.1% (+0.578)#4,578 |
| 74. | Sandy | 2.6% | 2.3% (+0.307)#74 | 2.1% (+0.567)#4,610 |
| 75. | Nibley | 2.6% | 2.3% (+0.301)#75 | 2.1% (+0.561)#4,625 |
| 76. | Providence | 2.6% | 2.3% (+0.253)#76 | 2.1% (+0.513)#4,759 |
| 77. | North Logan | 2.5% | 2.3% (+0.224)#77 | 2.1% (+0.484)#4,843 |
| 78. | Leeds | 2.5% | 2.3% (+0.219)#78 | 2.1% (+0.479)#4,854 |
| 79. | South Salt Lake | 2.5% | 2.3% (+0.218)#79 | 2.1% (+0.477)#4,857 |
| 80. | Hideout | 2.5% | 2.3% (+0.194)#80 | 2.1% (+0.454)#4,932 |
| 81. | Blanding | 2.5% | 2.3% (+0.147)#81 | 2.1% (+0.406)#5,081 |
| 82. | North Ogden | 2.5% | 2.3% (+0.139)#82 | 2.1% (+0.399)#5,106 |
| 83. | Plain City | 2.4% | 2.3% (+0.129)#83 | 2.1% (+0.389)#5,133 |
| 84. | Lehi | 2.4% | 2.3% (+0.124)#84 | 2.1% (+0.384)#5,156 |
| 85. | Centerville | 2.4% | 2.3% (+0.123)#85 | 2.1% (+0.383)#5,157 |
| 86. | American Fork | 2.4% | 2.3% (+0.112)#86 | 2.1% (+0.372)#5,199 |
| 87. | Spring City | 2.4% | 2.3% (+0.112)#87 | 2.1% (+0.372)#5,201 |
| 88. | Sunset | 2.4% | 2.3% (+0.089)#88 | 2.1% (+0.349)#5,268 |
| 89. | West Point | 2.4% | 2.3% (+0.069)#89 | 2.1% (+0.329)#5,330 |
| 90. | Palmyra | 2.4% | 2.3% (+0.038)#90 | 2.1% (+0.298)#5,419 |
| 91. | Layton | 2.4% | 2.3% (+0.034)#91 | 2.1% (+0.294)#5,431 |
| 92. | Santa Clara | 2.3% | 2.3% (+0.022)#92 | 2.1% (+0.282)#5,486 |
| 93. | Herriman | 2.3% | 2.3% (+0.008)#93 | 2.1% (+0.268)#5,535 |
| 94. | Richfield | 2.3% | 2.3% (-0.018)#94 | 2.1% (+0.242)#5,616 |
| 95. | White | 2.3% | 2.3% (-0.032)#95 | 2.1% (+0.228)#5,658 |
| 96. | Orem | 2.2% | 2.3% (-0.096)#96 | 2.1% (+0.164)#5,873 |
| 97. | Logan | 2.2% | 2.3% (-0.115)#97 | 2.1% (+0.145)#5,963 |
| 98. | Wellsville | 2.2% | 2.3% (-0.122)#98 | 2.1% (+0.138)#5,977 |
| 99. | Rush Valley | 2.2% | 2.3% (-0.123)#99 | 2.1% (+0.137)#5,986 |
| 100. | West Mountain | 2.2% | 2.3% (-0.154)#100 | 2.1% (+0.106)#6,095 |
Common Questions
What are the Top 10 Cities with the Highest Percentage of Population Employed in Arts, Media & Entertainment in Utah?
Top 10 Cities with the Highest Percentage of Population Employed in Arts, Media & Entertainment in Utah are:
#1
53.8%
#2
16.7%
#3
13.9%
#4
12.0%
#5
10.3%
#6
10.0%
#7
9.3%
#8
8.0%
#9
7.9%
#10
7.8%
What city has the Highest Percentage of Population Employed in Arts, Media & Entertainment in Utah?
Garden has the Highest Percentage of Population Employed in Arts, Media & Entertainment in Utah with 53.8%.
What is the Percentage of Population Employed in Arts, Media & Entertainment in the State of Utah?
Percentage of Population Employed in Arts, Media & Entertainment in Utah is 2.3%.
What is the Percentage of Population Employed in Arts, Media & Entertainment in the United States?
Percentage of Population Employed in Arts, Media & Entertainment in the United States is 2.1%.