Cities with the Highest Percentage of Population Employed in Arts, Media & Entertainment in Indiana
RELATED REPORTS & OPTIONS
Arts, Media & Entertainment
Indiana
Compare Cities
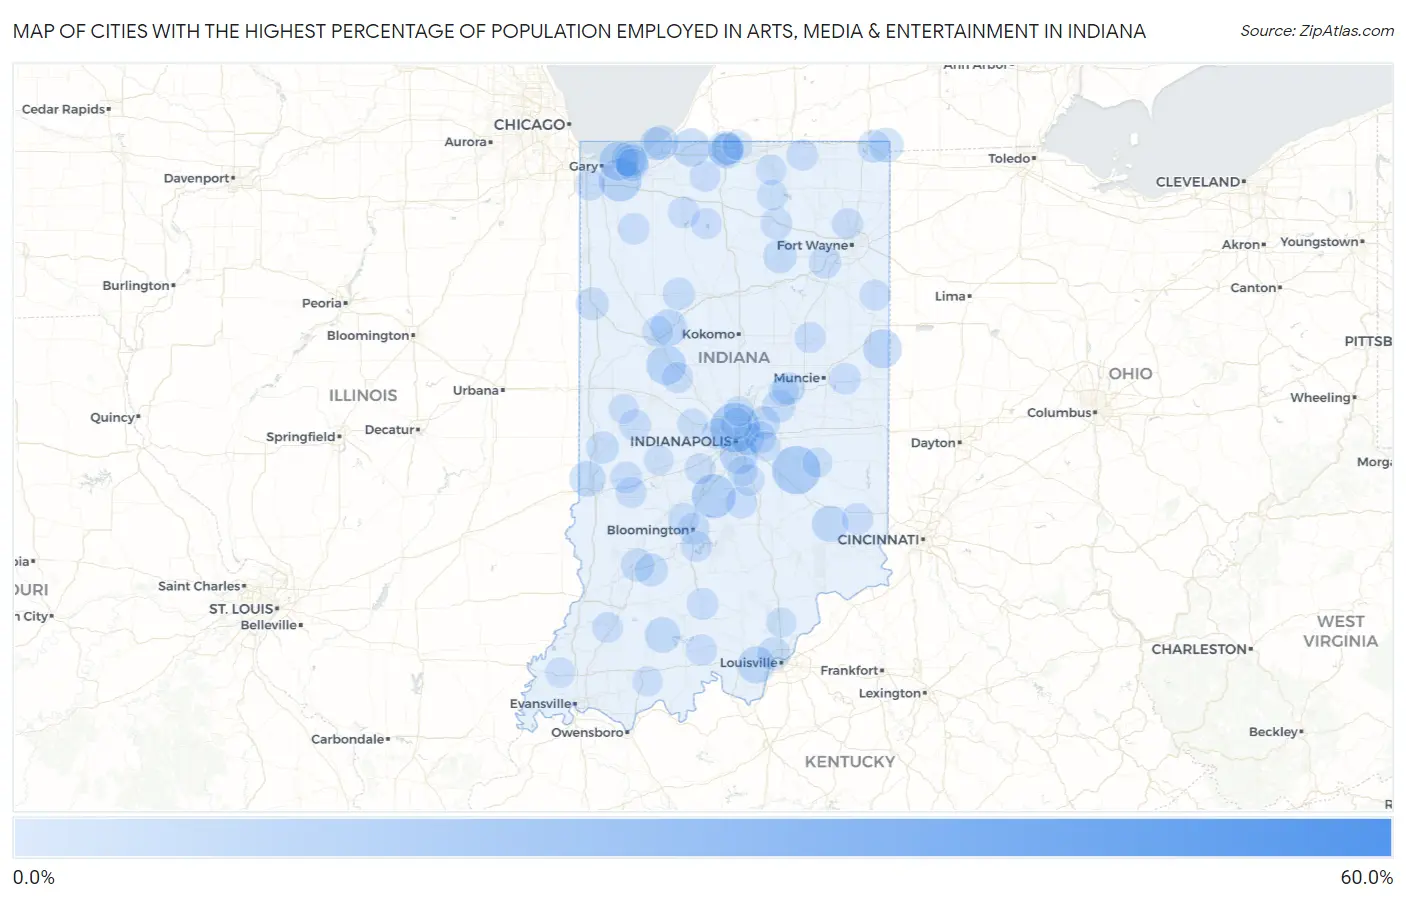
Map of Cities with the Highest Percentage of Population Employed in Arts, Media & Entertainment in Indiana
0.0%
60.0%
Cities with the Highest Percentage of Population Employed in Arts, Media & Entertainment in Indiana
| City | % Employed | vs State | vs National | |
| 1. | Lewis | 51.3% | 1.4%(+49.9)#1 | 2.1%(+49.2)#17 |
| 2. | Lucerne | 26.8% | 1.4%(+25.3)#2 | 2.1%(+24.7)#62 |
| 3. | Blairsville | 22.9% | 1.4%(+21.4)#3 | 2.1%(+20.8)#83 |
| 4. | Brimfield | 21.7% | 1.4%(+20.3)#4 | 2.1%(+19.6)#94 |
| 5. | Poland | 18.2% | 1.4%(+16.8)#5 | 2.1%(+16.1)#125 |
| 6. | Crows Nest | 13.8% | 1.4%(+12.4)#6 | 2.1%(+11.7)#219 |
| 7. | Manilla | 13.2% | 1.4%(+11.8)#7 | 2.1%(+11.1)#241 |
| 8. | Paxton | 13.1% | 1.4%(+11.7)#8 | 2.1%(+11.0)#244 |
| 9. | Lake Eliza | 12.1% | 1.4%(+10.7)#9 | 2.1%(+10.1)#279 |
| 10. | Petersville | 11.8% | 1.4%(+10.4)#10 | 2.1%(+9.77)#293 |
| 11. | Union Mills | 11.0% | 1.4%(+9.60)#11 | 2.1%(+8.95)#327 |
| 12. | Painted Hills | 10.6% | 1.4%(+9.22)#12 | 2.1%(+8.57)#346 |
| 13. | Bretzville | 10.6% | 1.4%(+9.19)#13 | 2.1%(+8.55)#347 |
| 14. | Wheeler | 9.9% | 1.4%(+8.46)#14 | 2.1%(+7.82)#395 |
| 15. | Hartz Lake | 9.6% | 1.4%(+8.16)#15 | 2.1%(+7.51)#418 |
| 16. | Hortonville | 9.4% | 1.4%(+7.99)#16 | 2.1%(+7.34)#431 |
| 17. | Benton | 8.4% | 1.4%(+6.99)#17 | 2.1%(+6.34)#536 |
| 18. | Lamb | 8.0% | 1.4%(+6.59)#18 | 2.1%(+5.94)#596 |
| 19. | Stockwell | 7.9% | 1.4%(+6.51)#19 | 2.1%(+5.87)#604 |
| 20. | Ogden Dunes | 7.6% | 1.4%(+6.19)#20 | 2.1%(+5.54)#663 |
| 21. | Spencerville | 7.5% | 1.4%(+6.14)#21 | 2.1%(+5.49)#675 |
| 22. | Salamonia | 7.4% | 1.4%(+6.03)#22 | 2.1%(+5.39)#699 |
| 23. | Grandview Lake | 7.0% | 1.4%(+5.57)#23 | 2.1%(+4.93)#789 |
| 24. | Hudson Lake | 7.0% | 1.4%(+5.55)#24 | 2.1%(+4.90)#798 |
| 25. | Homecroft | 6.9% | 1.4%(+5.51)#25 | 2.1%(+4.87)#805 |
| 26. | Lanesville | 6.5% | 1.4%(+5.12)#26 | 2.1%(+4.48)#898 |
| 27. | Americus | 6.1% | 1.4%(+4.73)#27 | 2.1%(+4.08)#1,008 |
| 28. | Napoleon | 6.0% | 1.4%(+4.59)#28 | 2.1%(+3.94)#1,051 |
| 29. | St Mary Of The Woods | 5.8% | 1.4%(+4.39)#29 | 2.1%(+3.74)#1,129 |
| 30. | Dubois | 5.6% | 1.4%(+4.20)#30 | 2.1%(+3.55)#1,202 |
| 31. | Snow Lake | 5.4% | 1.4%(+4.00)#31 | 2.1%(+3.36)#1,306 |
| 32. | Roseland | 5.3% | 1.4%(+3.87)#32 | 2.1%(+3.22)#1,367 |
| 33. | Dune Acres | 5.1% | 1.4%(+3.72)#33 | 2.1%(+3.07)#1,449 |
| 34. | Notre Dame | 5.0% | 1.4%(+3.62)#34 | 2.1%(+2.97)#1,494 |
| 35. | Michiana Shores | 5.0% | 1.4%(+3.56)#35 | 2.1%(+2.91)#1,542 |
| 36. | Haysville | 5.0% | 1.4%(+3.54)#36 | 2.1%(+2.89)#1,555 |
| 37. | Clear Lake | 4.9% | 1.4%(+3.47)#37 | 2.1%(+2.82)#1,593 |
| 38. | Gilmer Park | 4.7% | 1.4%(+3.30)#38 | 2.1%(+2.65)#1,710 |
| 39. | North Manchester | 4.5% | 1.4%(+3.11)#39 | 2.1%(+2.46)#1,838 |
| 40. | Porter | 4.4% | 1.4%(+3.00)#40 | 2.1%(+2.35)#1,919 |
| 41. | Newberry | 4.3% | 1.4%(+2.84)#41 | 2.1%(+2.19)#2,029 |
| 42. | Pendleton | 4.2% | 1.4%(+2.83)#42 | 2.1%(+2.18)#2,040 |
| 43. | New Albany | 4.2% | 1.4%(+2.80)#43 | 2.1%(+2.15)#2,066 |
| 44. | Long Beach | 4.1% | 1.4%(+2.70)#44 | 2.1%(+2.05)#2,156 |
| 45. | Earl Park | 4.1% | 1.4%(+2.67)#45 | 2.1%(+2.02)#2,182 |
| 46. | Crane | 4.0% | 1.4%(+2.63)#46 | 2.1%(+1.98)#2,225 |
| 47. | Warren Park | 4.0% | 1.4%(+2.63)#47 | 2.1%(+1.98)#2,231 |
| 48. | Chesterton | 4.0% | 1.4%(+2.55)#48 | 2.1%(+1.91)#2,306 |
| 49. | Mccordsville | 3.9% | 1.4%(+2.48)#49 | 2.1%(+1.83)#2,378 |
| 50. | Fremont | 3.8% | 1.4%(+2.43)#50 | 2.1%(+1.79)#2,411 |
| 51. | Woodlawn Heights | 3.8% | 1.4%(+2.43)#51 | 2.1%(+1.79)#2,420 |
| 52. | Mecca | 3.8% | 1.4%(+2.37)#52 | 2.1%(+1.72)#2,497 |
| 53. | Indian Village | 3.7% | 1.4%(+2.29)#53 | 2.1%(+1.64)#2,608 |
| 54. | Idaville | 3.6% | 1.4%(+2.22)#54 | 2.1%(+1.58)#2,675 |
| 55. | Cumberland | 3.6% | 1.4%(+2.19)#55 | 2.1%(+1.54)#2,713 |
| 56. | Roanoke | 3.6% | 1.4%(+2.17)#56 | 2.1%(+1.52)#2,732 |
| 57. | Meridian Hills | 3.4% | 1.4%(+2.02)#57 | 2.1%(+1.37)#2,949 |
| 58. | Winona Lake | 3.4% | 1.4%(+2.00)#58 | 2.1%(+1.35)#2,972 |
| 59. | Knox | 3.4% | 1.4%(+1.96)#59 | 2.1%(+1.31)#3,029 |
| 60. | Parker City | 3.4% | 1.4%(+1.95)#60 | 2.1%(+1.30)#3,049 |
| 61. | Bloomington | 3.4% | 1.4%(+1.94)#61 | 2.1%(+1.29)#3,060 |
| 62. | Ellettsville | 3.3% | 1.4%(+1.92)#62 | 2.1%(+1.27)#3,089 |
| 63. | Orleans | 3.3% | 1.4%(+1.92)#63 | 2.1%(+1.27)#3,101 |
| 64. | Brazil | 3.3% | 1.4%(+1.91)#64 | 2.1%(+1.26)#3,112 |
| 65. | Prince S Lakes | 3.3% | 1.4%(+1.90)#65 | 2.1%(+1.25)#3,136 |
| 66. | Waveland | 3.3% | 1.4%(+1.87)#66 | 2.1%(+1.22)#3,195 |
| 67. | Wheatfield | 3.3% | 1.4%(+1.85)#67 | 2.1%(+1.20)#3,228 |
| 68. | Sunman | 3.2% | 1.4%(+1.80)#68 | 2.1%(+1.15)#3,319 |
| 69. | Smithville Sanders | 3.1% | 1.4%(+1.72)#69 | 2.1%(+1.07)#3,467 |
| 70. | Huntertown | 3.1% | 1.4%(+1.72)#70 | 2.1%(+1.07)#3,469 |
| 71. | English | 3.1% | 1.4%(+1.69)#71 | 2.1%(+1.04)#3,515 |
| 72. | Franklin | 3.1% | 1.4%(+1.65)#72 | 2.1%(+1.01)#3,587 |
| 73. | Colfax | 3.0% | 1.4%(+1.58)#73 | 2.1%(+0.928)#3,729 |
| 74. | Shipshewana | 3.0% | 1.4%(+1.56)#74 | 2.1%(+0.914)#3,762 |
| 75. | Monrovia | 2.9% | 1.4%(+1.52)#75 | 2.1%(+0.870)#3,857 |
| 76. | Clermont | 2.9% | 1.4%(+1.51)#76 | 2.1%(+0.857)#3,878 |
| 77. | Center Point | 2.9% | 1.4%(+1.48)#77 | 2.1%(+0.829)#3,941 |
| 78. | Upland | 2.9% | 1.4%(+1.44)#78 | 2.1%(+0.792)#4,044 |
| 79. | North Liberty | 2.8% | 1.4%(+1.43)#79 | 2.1%(+0.781)#4,063 |
| 80. | Culver | 2.8% | 1.4%(+1.41)#80 | 2.1%(+0.765)#4,101 |
| 81. | Petersburg | 2.8% | 1.4%(+1.40)#81 | 2.1%(+0.751)#4,145 |
| 82. | Monroe | 2.8% | 1.4%(+1.39)#82 | 2.1%(+0.740)#4,171 |
| 83. | Battle Ground | 2.7% | 1.4%(+1.33)#83 | 2.1%(+0.683)#4,303 |
| 84. | Schererville | 2.7% | 1.4%(+1.32)#84 | 2.1%(+0.670)#4,339 |
| 85. | Milford | 2.7% | 1.4%(+1.32)#85 | 2.1%(+0.669)#4,341 |
| 86. | Lizton | 2.7% | 1.4%(+1.26)#86 | 2.1%(+0.613)#4,491 |
| 87. | Goshen | 2.6% | 1.4%(+1.15)#87 | 2.1%(+0.499)#4,801 |
| 88. | Underwood | 2.5% | 1.4%(+1.11)#88 | 2.1%(+0.463)#4,901 |
| 89. | Carmel | 2.5% | 1.4%(+1.10)#89 | 2.1%(+0.449)#4,949 |
| 90. | Edgewood | 2.5% | 1.4%(+1.09)#90 | 2.1%(+0.439)#4,978 |
| 91. | Barbee | 2.5% | 1.4%(+1.08)#91 | 2.1%(+0.428)#5,017 |
| 92. | Santa Claus | 2.5% | 1.4%(+1.06)#92 | 2.1%(+0.413)#5,060 |
| 93. | New Whiteland | 2.4% | 1.4%(+1.03)#93 | 2.1%(+0.378)#5,169 |
| 94. | New Palestine | 2.4% | 1.4%(+0.985)#94 | 2.1%(+0.336)#5,307 |
| 95. | Cynthiana | 2.4% | 1.4%(+0.978)#95 | 2.1%(+0.330)#5,324 |
| 96. | Henryville | 2.4% | 1.4%(+0.966)#96 | 2.1%(+0.318)#5,370 |
| 97. | Rushville | 2.4% | 1.4%(+0.954)#97 | 2.1%(+0.305)#5,400 |
| 98. | Wallace | 2.4% | 1.4%(+0.941)#98 | 2.1%(+0.292)#5,444 |
| 99. | Greencastle | 2.3% | 1.4%(+0.921)#99 | 2.1%(+0.272)#5,514 |
| 100. | Granger | 2.3% | 1.4%(+0.905)#100 | 2.1%(+0.256)#5,578 |
Common Questions
What are the Top 10 Cities with the Highest Percentage of Population Employed in Arts, Media & Entertainment in Indiana?
Top 10 Cities with the Highest Percentage of Population Employed in Arts, Media & Entertainment in Indiana are:
#1
13.8%
#2
13.2%
#3
10.6%
#4
9.9%
#5
7.9%
#6
7.6%
#7
7.4%
#8
7.0%
#9
6.9%
#10
6.5%
What city has the Highest Percentage of Population Employed in Arts, Media & Entertainment in Indiana?
Crows Nest has the Highest Percentage of Population Employed in Arts, Media & Entertainment in Indiana with 13.8%.
What is the Percentage of Population Employed in Arts, Media & Entertainment in the State of Indiana?
Percentage of Population Employed in Arts, Media & Entertainment in Indiana is 1.4%.
What is the Percentage of Population Employed in Arts, Media & Entertainment in the United States?
Percentage of Population Employed in Arts, Media & Entertainment in the United States is 2.1%.