Cities with the Highest Percentage of Population Employed in Arts, Media & Entertainment in South Carolina
RELATED REPORTS & OPTIONS
Arts, Media & Entertainment
South Carolina
Compare Cities
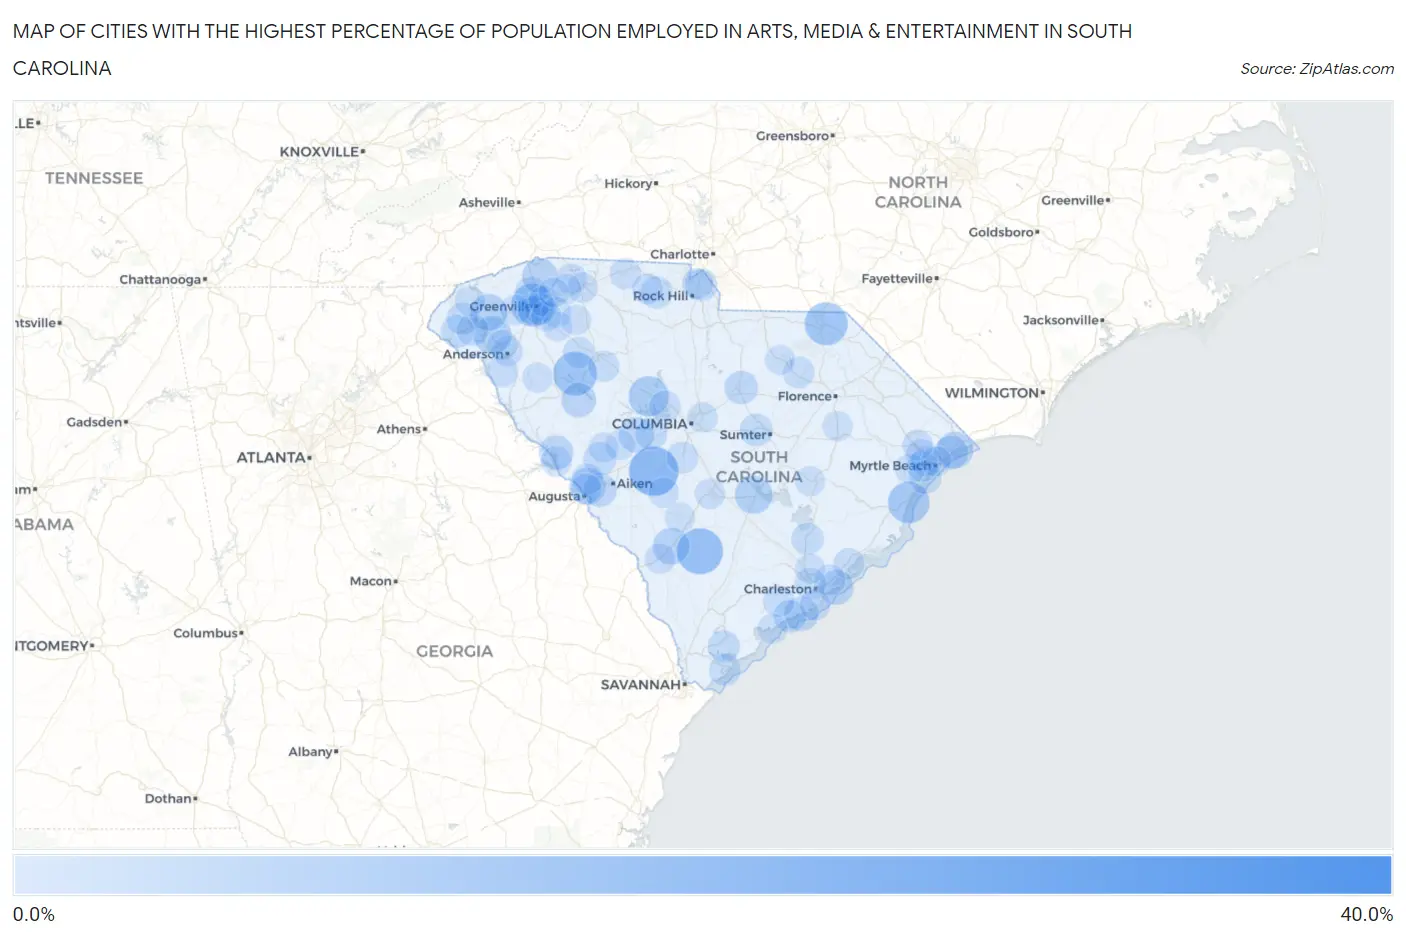
Map of Cities with the Highest Percentage of Population Employed in Arts, Media & Entertainment in South Carolina
0.0%
40.0%
Cities with the Highest Percentage of Population Employed in Arts, Media & Entertainment in South Carolina
| City | % Employed | vs State | vs National | |
| 1. | Zion | 34.5% | 1.5%(+33.0)#1 | 2.1%(+32.4)#38 |
| 2. | La France | 17.5% | 1.5%(+16.0)#2 | 2.1%(+15.5)#131 |
| 3. | Wagener | 16.9% | 1.5%(+15.4)#3 | 2.1%(+14.8)#146 |
| 4. | Lodge | 14.3% | 1.5%(+12.8)#4 | 2.1%(+12.2)#207 |
| 5. | Waterloo | 12.5% | 1.5%(+11.0)#5 | 2.1%(+10.4)#261 |
| 6. | Wallace | 11.8% | 1.5%(+10.3)#6 | 2.1%(+9.78)#289 |
| 7. | City View | 11.8% | 1.5%(+10.3)#7 | 2.1%(+9.77)#292 |
| 8. | Pawleys Island | 10.7% | 1.5%(+9.22)#8 | 2.1%(+8.65)#339 |
| 9. | Clemson University | 10.4% | 1.5%(+8.86)#9 | 2.1%(+8.29)#358 |
| 10. | Little Mountain | 9.7% | 1.5%(+8.23)#10 | 2.1%(+7.66)#408 |
| 11. | Dacusville | 8.6% | 1.5%(+7.08)#11 | 2.1%(+6.51)#514 |
| 12. | Pendleton | 7.9% | 1.5%(+6.36)#12 | 2.1%(+5.80)#615 |
| 13. | Buford | 7.8% | 1.5%(+6.26)#13 | 2.1%(+5.69)#635 |
| 14. | Santee | 7.7% | 1.5%(+6.24)#14 | 2.1%(+5.67)#641 |
| 15. | Six Mile | 7.1% | 1.5%(+5.62)#15 | 2.1%(+5.05)#771 |
| 16. | Ulmer | 7.0% | 1.5%(+5.52)#16 | 2.1%(+4.96)#784 |
| 17. | Atlantic Beach | 7.0% | 1.5%(+5.48)#17 | 2.1%(+4.92)#793 |
| 18. | Belvedere | 6.9% | 1.5%(+5.39)#18 | 2.1%(+4.82)#819 |
| 19. | Tigerville | 6.1% | 1.5%(+4.60)#19 | 2.1%(+4.03)#1,022 |
| 20. | Batesburg Leesville | 5.9% | 1.5%(+4.38)#20 | 2.1%(+3.82)#1,112 |
| 21. | The Cliffs Valley | 5.9% | 1.5%(+4.37)#21 | 2.1%(+3.80)#1,116 |
| 22. | Isle Of Palms | 5.5% | 1.5%(+4.03)#22 | 2.1%(+3.46)#1,252 |
| 23. | Ninety Six | 5.4% | 1.5%(+3.88)#23 | 2.1%(+3.31)#1,331 |
| 24. | Kiawah Island | 5.3% | 1.5%(+3.79)#24 | 2.1%(+3.23)#1,366 |
| 25. | Baxter | 5.3% | 1.5%(+3.78)#25 | 2.1%(+3.22)#1,376 |
| 26. | Parksville | 5.1% | 1.5%(+3.64)#26 | 2.1%(+3.07)#1,452 |
| 27. | Langley | 4.8% | 1.5%(+3.30)#27 | 2.1%(+2.73)#1,656 |
| 28. | Briarcliffe Acres | 4.7% | 1.5%(+3.23)#28 | 2.1%(+2.66)#1,701 |
| 29. | Camden | 4.6% | 1.5%(+3.06)#29 | 2.1%(+2.49)#1,813 |
| 30. | Trenton | 4.2% | 1.5%(+2.67)#30 | 2.1%(+2.11)#2,114 |
| 31. | Cherryvale | 4.0% | 1.5%(+2.52)#31 | 2.1%(+1.95)#2,253 |
| 32. | Westminster | 4.0% | 1.5%(+2.50)#32 | 2.1%(+1.93)#2,277 |
| 33. | Surfside Beach | 4.0% | 1.5%(+2.46)#33 | 2.1%(+1.90)#2,315 |
| 34. | Daufuskie Island | 3.8% | 1.5%(+2.33)#34 | 2.1%(+1.76)#2,439 |
| 35. | Seabrook Island | 3.8% | 1.5%(+2.28)#35 | 2.1%(+1.72)#2,502 |
| 36. | West Union | 3.7% | 1.5%(+2.19)#36 | 2.1%(+1.62)#2,624 |
| 37. | Sharon | 3.6% | 1.5%(+2.15)#37 | 2.1%(+1.58)#2,662 |
| 38. | Travelers Rest | 3.6% | 1.5%(+2.15)#38 | 2.1%(+1.58)#2,667 |
| 39. | Moncks Corner | 3.6% | 1.5%(+2.11)#39 | 2.1%(+1.54)#2,705 |
| 40. | Fort Mill | 3.4% | 1.5%(+1.95)#40 | 2.1%(+1.38)#2,935 |
| 41. | Port Royal | 3.4% | 1.5%(+1.95)#41 | 2.1%(+1.38)#2,936 |
| 42. | Gilbert | 3.2% | 1.5%(+1.73)#42 | 2.1%(+1.16)#3,287 |
| 43. | Seneca | 3.2% | 1.5%(+1.68)#43 | 2.1%(+1.11)#3,407 |
| 44. | Swansea | 3.2% | 1.5%(+1.66)#44 | 2.1%(+1.09)#3,434 |
| 45. | Hartsville | 3.1% | 1.5%(+1.65)#45 | 2.1%(+1.08)#3,451 |
| 46. | Laurens | 3.0% | 1.5%(+1.56)#46 | 2.1%(+0.987)#3,622 |
| 47. | Greenville | 3.0% | 1.5%(+1.55)#47 | 2.1%(+0.980)#3,633 |
| 48. | Red Hill | 3.0% | 1.5%(+1.53)#48 | 2.1%(+0.967)#3,659 |
| 49. | Hilton Head Island | 3.0% | 1.5%(+1.51)#49 | 2.1%(+0.943)#3,694 |
| 50. | Charleston | 3.0% | 1.5%(+1.46)#50 | 2.1%(+0.891)#3,807 |
| 51. | Meggett | 2.9% | 1.5%(+1.37)#51 | 2.1%(+0.804)#3,999 |
| 52. | Lake Murray Of Richland | 2.8% | 1.5%(+1.35)#52 | 2.1%(+0.785)#4,056 |
| 53. | Starr | 2.8% | 1.5%(+1.32)#53 | 2.1%(+0.756)#4,133 |
| 54. | Socastee | 2.8% | 1.5%(+1.29)#54 | 2.1%(+0.717)#4,217 |
| 55. | Awendaw | 2.8% | 1.5%(+1.26)#55 | 2.1%(+0.691)#4,282 |
| 56. | Joanna | 2.7% | 1.5%(+1.22)#56 | 2.1%(+0.650)#4,395 |
| 57. | Forestbrook | 2.6% | 1.5%(+1.10)#57 | 2.1%(+0.537)#4,680 |
| 58. | Murphys Estates | 2.6% | 1.5%(+1.10)#58 | 2.1%(+0.531)#4,704 |
| 59. | East Gaffney | 2.6% | 1.5%(+1.08)#59 | 2.1%(+0.517)#4,746 |
| 60. | Mount Pleasant | 2.6% | 1.5%(+1.06)#60 | 2.1%(+0.495)#4,815 |
| 61. | Riverview | 2.5% | 1.5%(+1.06)#61 | 2.1%(+0.487)#4,828 |
| 62. | Hickory Grove | 2.5% | 1.5%(+1.05)#62 | 2.1%(+0.481)#4,849 |
| 63. | Inman | 2.5% | 1.5%(+1.01)#63 | 2.1%(+0.443)#4,965 |
| 64. | Carolina Forest | 2.5% | 1.5%(+0.963)#64 | 2.1%(+0.394)#5,117 |
| 65. | Folly Beach | 2.4% | 1.5%(+0.956)#65 | 2.1%(+0.388)#5,137 |
| 66. | Modoc | 2.4% | 1.5%(+0.927)#66 | 2.1%(+0.358)#5,238 |
| 67. | Judson | 2.4% | 1.5%(+0.917)#67 | 2.1%(+0.349)#5,269 |
| 68. | Anderson | 2.4% | 1.5%(+0.894)#68 | 2.1%(+0.325)#5,342 |
| 69. | Dunean | 2.4% | 1.5%(+0.877)#69 | 2.1%(+0.309)#5,391 |
| 70. | North Augusta | 2.4% | 1.5%(+0.864)#70 | 2.1%(+0.296)#5,426 |
| 71. | Orangeburg | 2.3% | 1.5%(+0.847)#71 | 2.1%(+0.279)#5,494 |
| 72. | Southern Shops | 2.3% | 1.5%(+0.796)#72 | 2.1%(+0.227)#5,661 |
| 73. | Columbia | 2.3% | 1.5%(+0.782)#73 | 2.1%(+0.214)#5,706 |
| 74. | Springfield | 2.2% | 1.5%(+0.729)#74 | 2.1%(+0.161)#5,884 |
| 75. | Allendale | 2.2% | 1.5%(+0.724)#75 | 2.1%(+0.156)#5,918 |
| 76. | Conway | 2.2% | 1.5%(+0.674)#76 | 2.1%(+0.106)#6,097 |
| 77. | Northlake | 2.1% | 1.5%(+0.635)#77 | 2.1%(+0.067)#6,228 |
| 78. | Ridge Spring | 2.1% | 1.5%(+0.628)#78 | 2.1%(+0.060)#6,257 |
| 79. | Edisto Beach | 2.1% | 1.5%(+0.609)#79 | 2.1%(+0.041)#6,346 |
| 80. | Coward | 2.1% | 1.5%(+0.599)#80 | 2.1%(+0.031)#6,381 |
| 81. | Keowee Key | 2.1% | 1.5%(+0.591)#81 | 2.1%(+0.022)#6,409 |
| 82. | Bucksport | 2.1% | 1.5%(+0.585)#82 | 2.1%(+0.017)#6,431 |
| 83. | Wade Hampton | 2.1% | 1.5%(+0.579)#83 | 2.1%(+0.011)#6,459 |
| 84. | Drayton | 2.1% | 1.5%(+0.576)#84 | 2.1%(+0.008)#6,469 |
| 85. | Greeleyville | 2.1% | 1.5%(+0.576)#85 | 2.1%(+0.008)#6,472 |
| 86. | Five Forks | 2.0% | 1.5%(+0.543)#86 | 2.1%(-0.025)#6,601 |
| 87. | Due West | 2.0% | 1.5%(+0.538)#87 | 2.1%(-0.030)#6,626 |
| 88. | Myrtle Beach | 2.0% | 1.5%(+0.526)#88 | 2.1%(-0.042)#6,675 |
| 89. | Easley | 2.0% | 1.5%(+0.508)#89 | 2.1%(-0.060)#6,734 |
| 90. | Johnston | 2.0% | 1.5%(+0.499)#90 | 2.1%(-0.069)#6,786 |
| 91. | Denmark | 2.0% | 1.5%(+0.485)#91 | 2.1%(-0.083)#6,835 |
| 92. | Salem | 2.0% | 1.5%(+0.468)#92 | 2.1%(-0.100)#6,907 |
| 93. | Woodruff | 1.9% | 1.5%(+0.454)#93 | 2.1%(-0.114)#6,949 |
| 94. | Mcbee | 1.9% | 1.5%(+0.449)#94 | 2.1%(-0.119)#6,967 |
| 95. | Mauldin | 1.9% | 1.5%(+0.448)#95 | 2.1%(-0.120)#6,979 |
| 96. | Hanahan | 1.9% | 1.5%(+0.438)#96 | 2.1%(-0.130)#7,014 |
| 97. | Fountain Inn | 1.9% | 1.5%(+0.434)#97 | 2.1%(-0.134)#7,035 |
| 98. | Lyman | 1.9% | 1.5%(+0.408)#98 | 2.1%(-0.160)#7,127 |
| 99. | Olympia | 1.9% | 1.5%(+0.394)#99 | 2.1%(-0.174)#7,192 |
| 100. | Greer | 1.9% | 1.5%(+0.371)#100 | 2.1%(-0.197)#7,296 |
Common Questions
What are the Top 10 Cities with the Highest Percentage of Population Employed in Arts, Media & Entertainment in South Carolina?
Top 10 Cities with the Highest Percentage of Population Employed in Arts, Media & Entertainment in South Carolina are:
#1
16.9%
#2
14.3%
#3
12.5%
#4
11.8%
#5
11.8%
#6
10.7%
#7
9.7%
#8
7.9%
#9
7.7%
#10
7.1%
What city has the Highest Percentage of Population Employed in Arts, Media & Entertainment in South Carolina?
Wagener has the Highest Percentage of Population Employed in Arts, Media & Entertainment in South Carolina with 16.9%.
What is the Percentage of Population Employed in Arts, Media & Entertainment in the State of South Carolina?
Percentage of Population Employed in Arts, Media & Entertainment in South Carolina is 1.5%.
What is the Percentage of Population Employed in Arts, Media & Entertainment in the United States?
Percentage of Population Employed in Arts, Media & Entertainment in the United States is 2.1%.