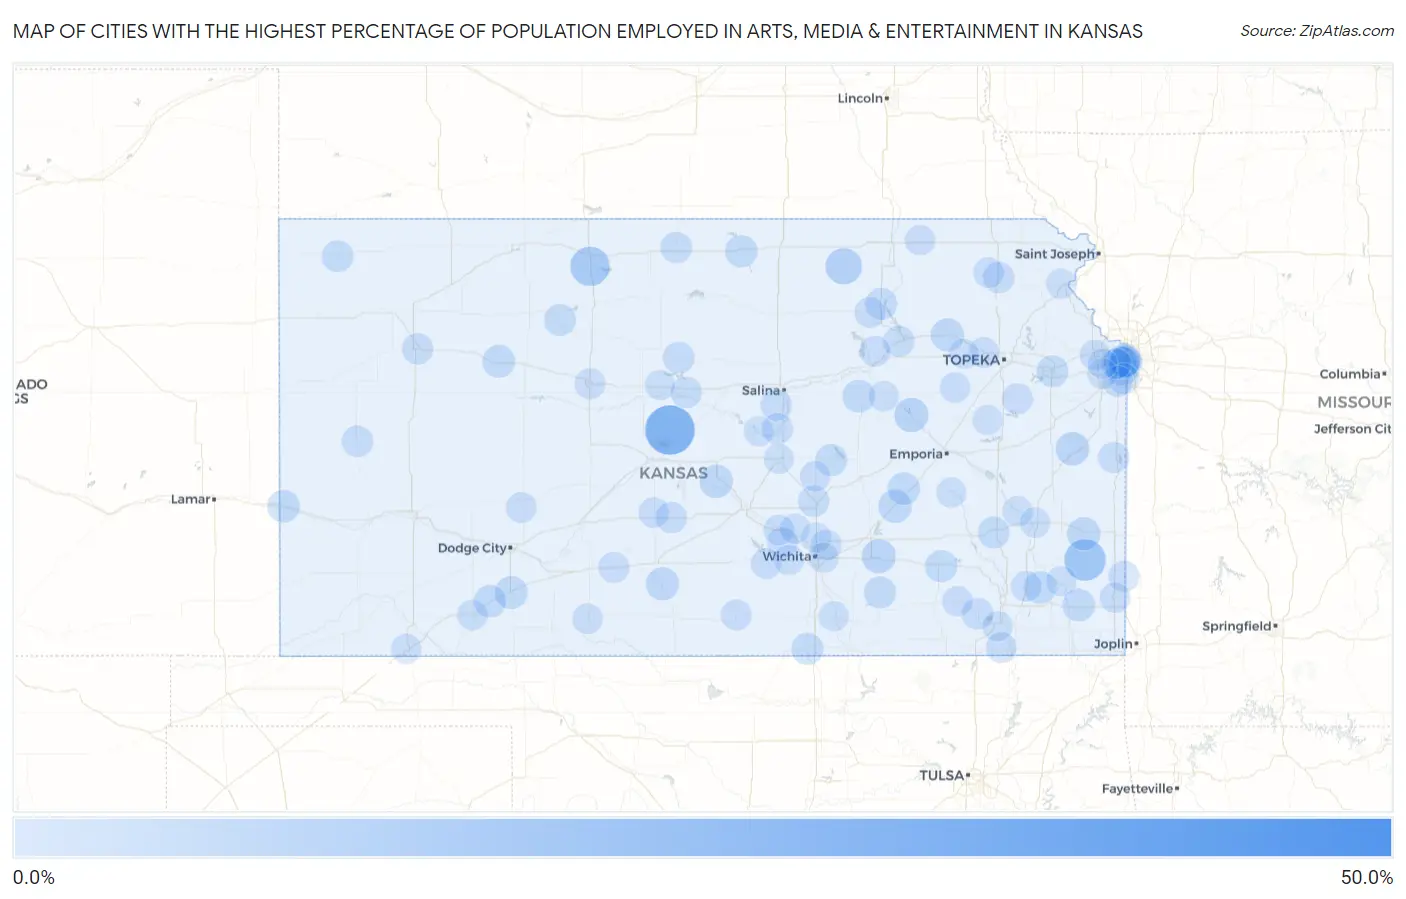
Cities with the Highest Percentage of Population Employed in Arts, Media & Entertainment in Kansas
RELATED REPORTS & OPTIONS
Arts, Media & Entertainment
Kansas
Compare Cities
Map of Cities with the Highest Percentage of Population Employed in Arts, Media & Entertainment in Kansas
0.0%
50.0%
Cities with the Highest Percentage of Population Employed in Arts, Media & Entertainment in Kansas
| City | % Employed | vs State | vs National | |
| 1. | Keats | 43.9% | 1.6%(+42.3)#1 | 2.1%(+41.8)#27 |
| 2. | Odin | 25.0% | 1.6%(+23.4)#2 | 2.1%(+22.9)#69 |
| 3. | Wabaunsee | 19.6% | 1.6%(+18.0)#3 | 2.1%(+17.5)#114 |
| 4. | Hepler | 15.2% | 1.6%(+13.6)#4 | 2.1%(+13.2)#177 |
| 5. | Tecumseh | 12.7% | 1.6%(+11.1)#5 | 2.1%(+10.6)#257 |
| 6. | Glade | 12.5% | 1.6%(+10.9)#6 | 2.1%(+10.4)#265 |
| 7. | Linn | 9.0% | 1.6%(+7.39)#7 | 2.1%(+6.90)#470 |
| 8. | Mission Woods | 7.4% | 1.6%(+5.84)#8 | 2.1%(+5.35)#704 |
| 9. | Council Grove | 6.7% | 1.6%(+5.10)#9 | 2.1%(+4.61)#858 |
| 10. | Leon | 6.2% | 1.6%(+4.61)#10 | 2.1%(+4.12)#997 |
| 11. | Lane | 6.0% | 1.6%(+4.38)#11 | 2.1%(+3.89)#1,072 |
| 12. | Uniontown | 5.6% | 1.6%(+4.04)#12 | 2.1%(+3.55)#1,206 |
| 13. | Sterling | 5.6% | 1.6%(+3.99)#13 | 2.1%(+3.50)#1,222 |
| 14. | Cassoday | 5.6% | 1.6%(+3.98)#14 | 2.1%(+3.49)#1,233 |
| 15. | Sawyer | 5.4% | 1.6%(+3.83)#15 | 2.1%(+3.34)#1,312 |
| 16. | Belvue | 5.4% | 1.6%(+3.80)#16 | 2.1%(+3.32)#1,325 |
| 17. | Collyer | 5.0% | 1.6%(+3.43)#17 | 2.1%(+2.94)#1,524 |
| 18. | Minneola | 5.0% | 1.6%(+3.41)#18 | 2.1%(+2.92)#1,534 |
| 19. | Woodbine | 4.9% | 1.6%(+3.35)#19 | 2.1%(+2.86)#1,573 |
| 20. | Mission | 4.9% | 1.6%(+3.28)#20 | 2.1%(+2.79)#1,612 |
| 21. | Mccune | 4.8% | 1.6%(+3.26)#21 | 2.1%(+2.77)#1,643 |
| 22. | Galesburg | 4.8% | 1.6%(+3.19)#22 | 2.1%(+2.70)#1,678 |
| 23. | Prairie Village | 4.7% | 1.6%(+3.17)#23 | 2.1%(+2.68)#1,687 |
| 24. | Coolidge | 4.5% | 1.6%(+2.97)#24 | 2.1%(+2.48)#1,827 |
| 25. | Matfield Green | 4.5% | 1.6%(+2.97)#25 | 2.1%(+2.48)#1,828 |
| 26. | Fowler | 4.5% | 1.6%(+2.93)#26 | 2.1%(+2.44)#1,852 |
| 27. | Formoso | 4.3% | 1.6%(+2.78)#27 | 2.1%(+2.29)#1,971 |
| 28. | Severy | 4.3% | 1.6%(+2.70)#28 | 2.1%(+2.21)#2,016 |
| 29. | Westwood Hills | 4.1% | 1.6%(+2.51)#29 | 2.1%(+2.02)#2,181 |
| 30. | Atlanta | 4.1% | 1.6%(+2.51)#30 | 2.1%(+2.02)#2,186 |
| 31. | Hillsboro | 4.1% | 1.6%(+2.48)#31 | 2.1%(+1.99)#2,212 |
| 32. | Randolph | 4.0% | 1.6%(+2.47)#32 | 2.1%(+1.98)#2,227 |
| 33. | South Haven | 3.9% | 1.6%(+2.36)#33 | 2.1%(+1.87)#2,330 |
| 34. | Yates Center | 3.9% | 1.6%(+2.36)#34 | 2.1%(+1.87)#2,333 |
| 35. | Damar | 3.8% | 1.6%(+2.23)#35 | 2.1%(+1.74)#2,472 |
| 36. | Bird City | 3.7% | 1.6%(+2.10)#36 | 2.1%(+1.62)#2,627 |
| 37. | Lawrence | 3.6% | 1.6%(+2.08)#37 | 2.1%(+1.59)#2,660 |
| 38. | Lucas | 3.5% | 1.6%(+1.97)#38 | 2.1%(+1.48)#2,802 |
| 39. | Elk City | 3.5% | 1.6%(+1.96)#39 | 2.1%(+1.47)#2,817 |
| 40. | Lebanon | 3.5% | 1.6%(+1.96)#40 | 2.1%(+1.47)#2,818 |
| 41. | Westwood | 3.5% | 1.6%(+1.95)#41 | 2.1%(+1.46)#2,823 |
| 42. | Leoti | 3.5% | 1.6%(+1.93)#42 | 2.1%(+1.44)#2,857 |
| 43. | Stafford | 3.3% | 1.6%(+1.72)#43 | 2.1%(+1.23)#3,174 |
| 44. | Smolan | 3.2% | 1.6%(+1.65)#44 | 2.1%(+1.16)#3,293 |
| 45. | Netawaka | 3.2% | 1.6%(+1.65)#45 | 2.1%(+1.16)#3,294 |
| 46. | Manhattan | 3.2% | 1.6%(+1.65)#46 | 2.1%(+1.16)#3,302 |
| 47. | Fairway | 3.1% | 1.6%(+1.54)#47 | 2.1%(+1.05)#3,501 |
| 48. | Oakley | 3.1% | 1.6%(+1.53)#48 | 2.1%(+1.04)#3,513 |
| 49. | Lindsborg | 3.1% | 1.6%(+1.50)#49 | 2.1%(+1.01)#3,576 |
| 50. | North Newton | 3.1% | 1.6%(+1.48)#50 | 2.1%(+0.994)#3,604 |
| 51. | Wilson | 3.0% | 1.6%(+1.46)#51 | 2.1%(+0.969)#3,652 |
| 52. | Linn Valley | 3.0% | 1.6%(+1.39)#52 | 2.1%(+0.905)#3,778 |
| 53. | Leonardville | 2.9% | 1.6%(+1.34)#53 | 2.1%(+0.856)#3,883 |
| 54. | Mulberry | 2.9% | 1.6%(+1.31)#54 | 2.1%(+0.817)#3,972 |
| 55. | Overbrook | 2.8% | 1.6%(+1.26)#55 | 2.1%(+0.767)#4,097 |
| 56. | Haviland | 2.8% | 1.6%(+1.25)#56 | 2.1%(+0.764)#4,107 |
| 57. | Harper | 2.8% | 1.6%(+1.24)#57 | 2.1%(+0.756)#4,126 |
| 58. | Silver Lake | 2.8% | 1.6%(+1.24)#58 | 2.1%(+0.747)#4,159 |
| 59. | Leawood | 2.8% | 1.6%(+1.23)#59 | 2.1%(+0.736)#4,182 |
| 60. | Fort Riley | 2.8% | 1.6%(+1.20)#60 | 2.1%(+0.710)#4,240 |
| 61. | Overland Park | 2.7% | 1.6%(+1.16)#61 | 2.1%(+0.669)#4,342 |
| 62. | Hays | 2.7% | 1.6%(+1.16)#62 | 2.1%(+0.668)#4,347 |
| 63. | Andale | 2.6% | 1.6%(+0.983)#63 | 2.1%(+0.494)#4,816 |
| 64. | Cheney | 2.6% | 1.6%(+0.980)#64 | 2.1%(+0.491)#4,821 |
| 65. | Meade | 2.5% | 1.6%(+0.955)#65 | 2.1%(+0.466)#4,886 |
| 66. | Jetmore | 2.5% | 1.6%(+0.949)#66 | 2.1%(+0.460)#4,905 |
| 67. | Wetmore | 2.5% | 1.6%(+0.949)#67 | 2.1%(+0.460)#4,907 |
| 68. | Thayer | 2.5% | 1.6%(+0.913)#68 | 2.1%(+0.424)#5,027 |
| 69. | Bonner Springs | 2.5% | 1.6%(+0.909)#69 | 2.1%(+0.420)#5,040 |
| 70. | Goessel | 2.4% | 1.6%(+0.857)#70 | 2.1%(+0.368)#5,210 |
| 71. | Dearing | 2.4% | 1.6%(+0.838)#71 | 2.1%(+0.349)#5,273 |
| 72. | Eskridge | 2.4% | 1.6%(+0.795)#72 | 2.1%(+0.306)#5,399 |
| 73. | Merriam | 2.4% | 1.6%(+0.789)#73 | 2.1%(+0.300)#5,414 |
| 74. | St John | 2.3% | 1.6%(+0.777)#74 | 2.1%(+0.288)#5,456 |
| 75. | Coldwater | 2.3% | 1.6%(+0.701)#75 | 2.1%(+0.212)#5,717 |
| 76. | Mount Hope | 2.3% | 1.6%(+0.689)#76 | 2.1%(+0.200)#5,768 |
| 77. | Longton | 2.3% | 1.6%(+0.684)#77 | 2.1%(+0.195)#5,785 |
| 78. | Pittsburg | 2.2% | 1.6%(+0.676)#78 | 2.1%(+0.187)#5,806 |
| 79. | Bel Aire | 2.2% | 1.6%(+0.668)#79 | 2.1%(+0.179)#5,838 |
| 80. | Beattie | 2.2% | 1.6%(+0.667)#80 | 2.1%(+0.178)#5,841 |
| 81. | Lenexa | 2.2% | 1.6%(+0.650)#81 | 2.1%(+0.161)#5,901 |
| 82. | Independence | 2.2% | 1.6%(+0.642)#82 | 2.1%(+0.153)#5,930 |
| 83. | St Paul | 2.2% | 1.6%(+0.602)#83 | 2.1%(+0.113)#6,060 |
| 84. | Neosho Falls | 2.2% | 1.6%(+0.602)#84 | 2.1%(+0.113)#6,068 |
| 85. | Goddard | 2.2% | 1.6%(+0.599)#85 | 2.1%(+0.110)#6,079 |
| 86. | Park City | 2.2% | 1.6%(+0.597)#86 | 2.1%(+0.108)#6,088 |
| 87. | Atchison | 2.2% | 1.6%(+0.590)#87 | 2.1%(+0.101)#6,115 |
| 88. | White City | 2.2% | 1.6%(+0.579)#88 | 2.1%(+0.090)#6,151 |
| 89. | Bentley | 2.0% | 1.6%(+0.469)#89 | 2.1%(-0.020)#6,583 |
| 90. | Iola | 2.0% | 1.6%(+0.459)#90 | 2.1%(-0.030)#6,625 |
| 91. | Madison | 2.0% | 1.6%(+0.424)#91 | 2.1%(-0.065)#6,766 |
| 92. | Mcpherson | 2.0% | 1.6%(+0.386)#92 | 2.1%(-0.103)#6,913 |
| 93. | Oxford | 2.0% | 1.6%(+0.382)#93 | 2.1%(-0.107)#6,924 |
| 94. | Osage City | 2.0% | 1.6%(+0.381)#94 | 2.1%(-0.108)#6,928 |
| 95. | Marquette | 1.9% | 1.6%(+0.362)#95 | 2.1%(-0.127)#7,004 |
| 96. | Maple Hill | 1.9% | 1.6%(+0.344)#96 | 2.1%(-0.145)#7,078 |
| 97. | Shawnee | 1.9% | 1.6%(+0.342)#97 | 2.1%(-0.146)#7,082 |
| 98. | Eastborough | 1.9% | 1.6%(+0.341)#98 | 2.1%(-0.148)#7,089 |
| 99. | Liberal | 1.9% | 1.6%(+0.328)#99 | 2.1%(-0.161)#7,133 |
| 100. | Bunker Hill | 1.9% | 1.6%(+0.315)#100 | 2.1%(-0.174)#7,209 |
Common Questions
What are the Top 10 Cities with the Highest Percentage of Population Employed in Arts, Media & Entertainment in Kansas?
Top 10 Cities with the Highest Percentage of Population Employed in Arts, Media & Entertainment in Kansas are:
#1
25.0%
#2
15.2%
#3
12.5%
#4
9.0%
#5
7.4%
#6
6.7%
#7
6.2%
#8
6.0%
#9
5.6%
#10
5.6%
What city has the Highest Percentage of Population Employed in Arts, Media & Entertainment in Kansas?
Odin has the Highest Percentage of Population Employed in Arts, Media & Entertainment in Kansas with 25.0%.
What is the Percentage of Population Employed in Arts, Media & Entertainment in the State of Kansas?
Percentage of Population Employed in Arts, Media & Entertainment in Kansas is 1.6%.
What is the Percentage of Population Employed in Arts, Media & Entertainment in the United States?
Percentage of Population Employed in Arts, Media & Entertainment in the United States is 2.1%.