Cities with the Highest Percentage of Population Employed in Arts, Media & Entertainment in Illinois
RELATED REPORTS & OPTIONS
Arts, Media & Entertainment
Illinois
Compare Cities
Map of Cities with the Highest Percentage of Population Employed in Arts, Media & Entertainment in Illinois
0.0%
20.0%
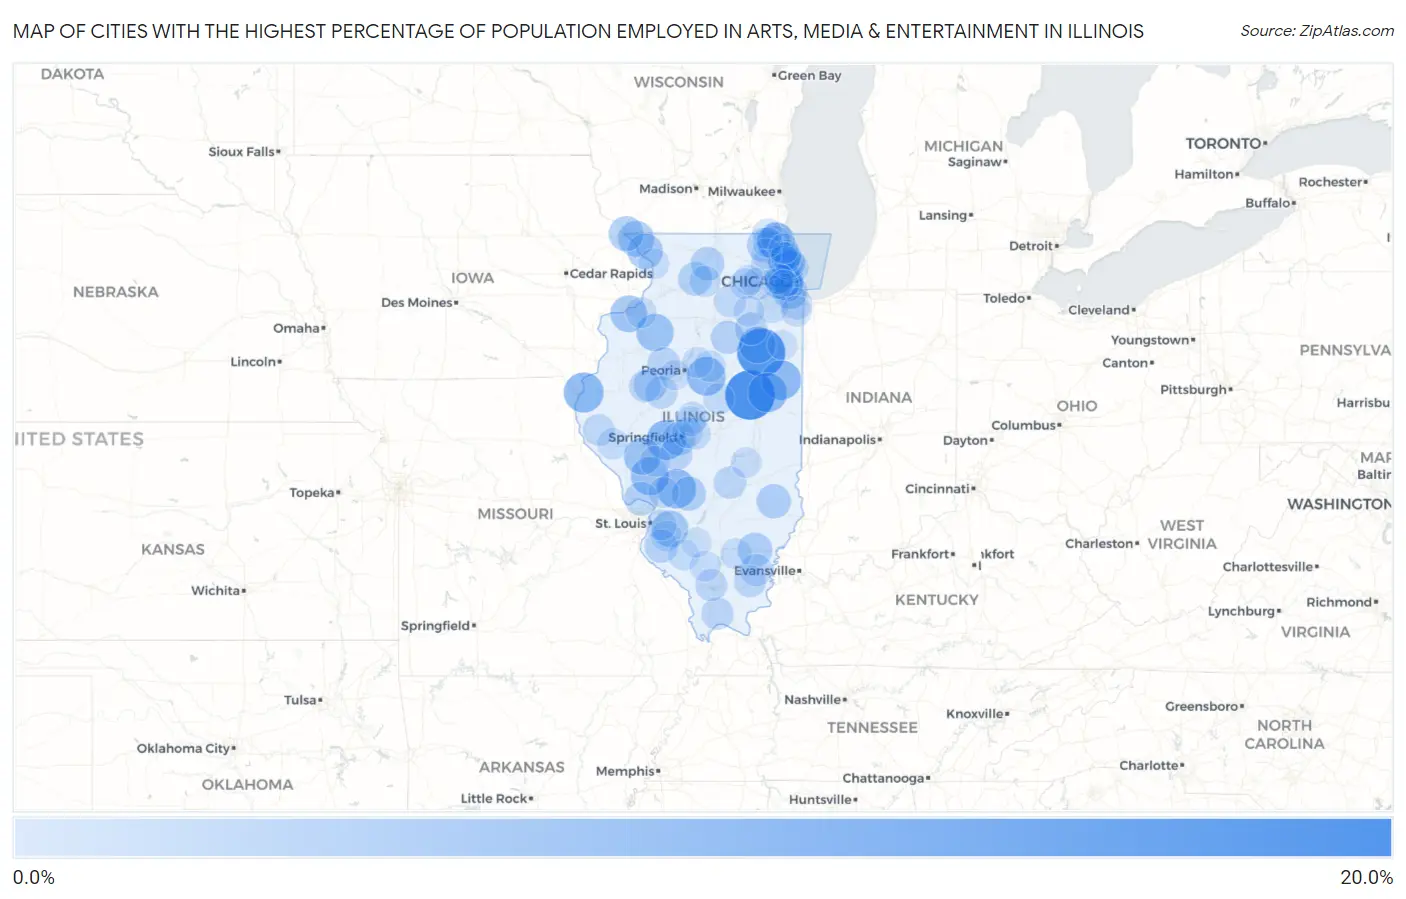
Cities with the Highest Percentage of Population Employed in Arts, Media & Entertainment in Illinois
| City | % Employed | vs State | vs National | |
| 1. | Foosland | 15.4% | 1.9% (+13.5)#1 | 2.1% (+13.3)#175 |
| 2. | Kempton | 14.4% | 1.9% (+12.5)#2 | 2.1% (+12.3)#202 |
| 3. | Literberry | 12.7% | 1.9% (+10.8)#3 | 2.1% (+10.6)#256 |
| 4. | Hamilton | 9.3% | 1.9% (+7.35)#4 | 2.1% (+7.21)#442 |
| 5. | Cissna Park | 9.1% | 1.9% (+7.17)#5 | 2.1% (+7.03)#454 |
| 6. | Berlin | 9.1% | 1.9% (+7.17)#6 | 2.1% (+7.03)#458 |
| 7. | Lake Ka Ho | 9.0% | 1.9% (+7.07)#7 | 2.1% (+6.93)#466 |
| 8. | Ludlow | 8.9% | 1.9% (+7.00)#8 | 2.1% (+6.86)#474 |
| 9. | Congerville | 8.6% | 1.9% (+6.64)#9 | 2.1% (+6.49)#515 |
| 10. | Rockbridge | 8.2% | 1.9% (+6.24)#10 | 2.1% (+6.10)#569 |
| 11. | Bishop Hill | 7.7% | 1.9% (+5.77)#11 | 2.1% (+5.63)#650 |
| 12. | Grandwood Park | 7.5% | 1.9% (+5.62)#12 | 2.1% (+5.48)#677 |
| 13. | Manchester | 7.5% | 1.9% (+5.61)#13 | 2.1% (+5.47)#682 |
| 14. | Campus | 7.4% | 1.9% (+5.43)#14 | 2.1% (+5.29)#714 |
| 15. | Milan | 7.3% | 1.9% (+5.37)#15 | 2.1% (+5.23)#729 |
| 16. | Scott Afb | 7.0% | 1.9% (+5.10)#16 | 2.1% (+4.96)#781 |
| 17. | Riverside | 7.0% | 1.9% (+5.05)#17 | 2.1% (+4.91)#796 |
| 18. | Galena | 6.8% | 1.9% (+4.86)#18 | 2.1% (+4.72)#841 |
| 19. | Hanover | 6.5% | 1.9% (+4.59)#19 | 2.1% (+4.44)#908 |
| 20. | Hometown | 6.3% | 1.9% (+4.35)#20 | 2.1% (+4.21)#972 |
| 21. | East Dubuque | 6.3% | 1.9% (+4.34)#21 | 2.1% (+4.20)#974 |
| 22. | Mill Shoals | 6.0% | 1.9% (+4.05)#22 | 2.1% (+3.91)#1,066 |
| 23. | Ste Marie | 5.8% | 1.9% (+3.92)#23 | 2.1% (+3.78)#1,121 |
| 24. | Blairsville | 5.8% | 1.9% (+3.87)#24 | 2.1% (+3.73)#1,133 |
| 25. | Panama | 5.8% | 1.9% (+3.84)#25 | 2.1% (+3.69)#1,147 |
| 26. | Elsah | 5.6% | 1.9% (+3.64)#26 | 2.1% (+3.49)#1,228 |
| 27. | Lakemoor | 5.5% | 1.9% (+3.62)#27 | 2.1% (+3.48)#1,243 |
| 28. | Grand Detour | 5.5% | 1.9% (+3.60)#28 | 2.1% (+3.46)#1,255 |
| 29. | Third Lake | 5.4% | 1.9% (+3.51)#29 | 2.1% (+3.37)#1,298 |
| 30. | Stillman Valley | 5.4% | 1.9% (+3.50)#30 | 2.1% (+3.35)#1,307 |
| 31. | Leland Grove | 5.4% | 1.9% (+3.45)#31 | 2.1% (+3.31)#1,330 |
| 32. | River Forest | 5.2% | 1.9% (+3.32)#32 | 2.1% (+3.17)#1,398 |
| 33. | Streator | 5.2% | 1.9% (+3.31)#33 | 2.1% (+3.17)#1,402 |
| 34. | Hecker | 5.1% | 1.9% (+3.22)#34 | 2.1% (+3.08)#1,443 |
| 35. | Cuba | 5.0% | 1.9% (+3.10)#35 | 2.1% (+2.96)#1,500 |
| 36. | Elmwood | 5.0% | 1.9% (+3.04)#36 | 2.1% (+2.90)#1,551 |
| 37. | Auburn | 4.8% | 1.9% (+2.93)#37 | 2.1% (+2.79)#1,613 |
| 38. | Mazon | 4.8% | 1.9% (+2.92)#38 | 2.1% (+2.78)#1,627 |
| 39. | Deerfield | 4.8% | 1.9% (+2.92)#39 | 2.1% (+2.78)#1,632 |
| 40. | Evanston | 4.8% | 1.9% (+2.86)#40 | 2.1% (+2.71)#1,663 |
| 41. | Stickney | 4.7% | 1.9% (+2.80)#41 | 2.1% (+2.66)#1,702 |
| 42. | Liverpool | 4.7% | 1.9% (+2.73)#42 | 2.1% (+2.59)#1,755 |
| 43. | Oak Park | 4.6% | 1.9% (+2.72)#43 | 2.1% (+2.58)#1,761 |
| 44. | Beecher City | 4.6% | 1.9% (+2.72)#44 | 2.1% (+2.58)#1,762 |
| 45. | Cypress | 4.5% | 1.9% (+2.63)#45 | 2.1% (+2.48)#1,825 |
| 46. | Norris City | 4.5% | 1.9% (+2.57)#46 | 2.1% (+2.43)#1,866 |
| 47. | Smithfield | 4.5% | 1.9% (+2.56)#47 | 2.1% (+2.42)#1,875 |
| 48. | Cambria | 4.5% | 1.9% (+2.53)#48 | 2.1% (+2.39)#1,886 |
| 49. | Eldorado | 4.4% | 1.9% (+2.53)#49 | 2.1% (+2.39)#1,890 |
| 50. | Batavia | 4.4% | 1.9% (+2.52)#50 | 2.1% (+2.37)#1,899 |
| 51. | Leland | 4.3% | 1.9% (+2.42)#51 | 2.1% (+2.28)#1,978 |
| 52. | Trivoli | 4.3% | 1.9% (+2.41)#52 | 2.1% (+2.27)#1,983 |
| 53. | Liberty | 4.3% | 1.9% (+2.39)#53 | 2.1% (+2.25)#1,993 |
| 54. | Thornton | 4.2% | 1.9% (+2.30)#54 | 2.1% (+2.16)#2,054 |
| 55. | Northfield | 4.2% | 1.9% (+2.28)#55 | 2.1% (+2.14)#2,083 |
| 56. | Buffalo | 4.1% | 1.9% (+2.18)#56 | 2.1% (+2.04)#2,166 |
| 57. | Broadwell | 4.1% | 1.9% (+2.16)#57 | 2.1% (+2.02)#2,185 |
| 58. | Riverwoods | 4.1% | 1.9% (+2.16)#58 | 2.1% (+2.02)#2,189 |
| 59. | Secor | 4.0% | 1.9% (+2.11)#59 | 2.1% (+1.97)#2,237 |
| 60. | Ashton | 4.0% | 1.9% (+2.10)#60 | 2.1% (+1.96)#2,243 |
| 61. | Wilmette | 4.0% | 1.9% (+2.09)#61 | 2.1% (+1.95)#2,254 |
| 62. | Holcomb | 4.0% | 1.9% (+2.08)#62 | 2.1% (+1.94)#2,269 |
| 63. | South Barrington | 4.0% | 1.9% (+2.05)#63 | 2.1% (+1.91)#2,299 |
| 64. | Ingalls Park | 4.0% | 1.9% (+2.05)#64 | 2.1% (+1.91)#2,307 |
| 65. | Dahlgren | 3.9% | 1.9% (+2.00)#65 | 2.1% (+1.86)#2,345 |
| 66. | New Salem | 3.9% | 1.9% (+2.00)#66 | 2.1% (+1.86)#2,347 |
| 67. | Northbrook | 3.9% | 1.9% (+1.94)#67 | 2.1% (+1.79)#2,406 |
| 68. | Heyworth | 3.8% | 1.9% (+1.91)#68 | 2.1% (+1.77)#2,429 |
| 69. | Freeburg | 3.8% | 1.9% (+1.91)#69 | 2.1% (+1.77)#2,431 |
| 70. | Coulterville | 3.8% | 1.9% (+1.88)#70 | 2.1% (+1.74)#2,463 |
| 71. | Metamora | 3.8% | 1.9% (+1.87)#71 | 2.1% (+1.73)#2,480 |
| 72. | South Chicago Heights | 3.8% | 1.9% (+1.85)#72 | 2.1% (+1.71)#2,507 |
| 73. | Old Mill Creek | 3.8% | 1.9% (+1.85)#73 | 2.1% (+1.71)#2,510 |
| 74. | Bunker Hill | 3.8% | 1.9% (+1.85)#74 | 2.1% (+1.71)#2,511 |
| 75. | Fairview Heights | 3.8% | 1.9% (+1.85)#75 | 2.1% (+1.71)#2,516 |
| 76. | Spaulding | 3.8% | 1.9% (+1.84)#76 | 2.1% (+1.70)#2,525 |
| 77. | Lisbon | 3.8% | 1.9% (+1.84)#77 | 2.1% (+1.70)#2,528 |
| 78. | Colona | 3.7% | 1.9% (+1.81)#78 | 2.1% (+1.67)#2,554 |
| 79. | St Johns | 3.7% | 1.9% (+1.78)#79 | 2.1% (+1.64)#2,607 |
| 80. | Savanna | 3.7% | 1.9% (+1.78)#80 | 2.1% (+1.63)#2,615 |
| 81. | Berkeley | 3.7% | 1.9% (+1.75)#81 | 2.1% (+1.61)#2,640 |
| 82. | Kaneville | 3.7% | 1.9% (+1.74)#82 | 2.1% (+1.59)#2,655 |
| 83. | Winnetka | 3.6% | 1.9% (+1.72)#83 | 2.1% (+1.58)#2,669 |
| 84. | Gays | 3.6% | 1.9% (+1.70)#84 | 2.1% (+1.55)#2,696 |
| 85. | Oak Brook | 3.6% | 1.9% (+1.68)#85 | 2.1% (+1.54)#2,710 |
| 86. | Highwood | 3.6% | 1.9% (+1.68)#86 | 2.1% (+1.54)#2,712 |
| 87. | Scottville | 3.6% | 1.9% (+1.65)#87 | 2.1% (+1.51)#2,755 |
| 88. | Highland Park | 3.6% | 1.9% (+1.65)#88 | 2.1% (+1.51)#2,764 |
| 89. | Elmhurst | 3.5% | 1.9% (+1.57)#89 | 2.1% (+1.43)#2,863 |
| 90. | Lake Catherine | 3.5% | 1.9% (+1.54)#90 | 2.1% (+1.40)#2,908 |
| 91. | Elburn | 3.5% | 1.9% (+1.54)#91 | 2.1% (+1.40)#2,911 |
| 92. | Alvan | 3.4% | 1.9% (+1.53)#92 | 2.1% (+1.39)#2,928 |
| 93. | Brookfield | 3.4% | 1.9% (+1.52)#93 | 2.1% (+1.38)#2,943 |
| 94. | Tower Lakes | 3.4% | 1.9% (+1.49)#94 | 2.1% (+1.35)#2,971 |
| 95. | Lake Camelot | 3.4% | 1.9% (+1.48)#95 | 2.1% (+1.34)#2,989 |
| 96. | Elkhart | 3.4% | 1.9% (+1.47)#96 | 2.1% (+1.33)#3,003 |
| 97. | Nashville | 3.4% | 1.9% (+1.45)#97 | 2.1% (+1.31)#3,036 |
| 98. | Long Lake | 3.4% | 1.9% (+1.44)#98 | 2.1% (+1.30)#3,048 |
| 99. | Lake Bluff | 3.3% | 1.9% (+1.38)#99 | 2.1% (+1.24)#3,149 |
| 100. | Sammons Point | 3.3% | 1.9% (+1.38)#100 | 2.1% (+1.24)#3,162 |
Common Questions
What are the Top 10 Cities with the Highest Percentage of Population Employed in Arts, Media & Entertainment in Illinois?
Top 10 Cities with the Highest Percentage of Population Employed in Arts, Media & Entertainment in Illinois are:
#1
15.4%
#2
14.4%
#3
9.3%
#4
9.1%
#5
9.1%
#6
9.0%
#7
8.9%
#8
8.6%
#9
8.2%
#10
7.7%
What city has the Highest Percentage of Population Employed in Arts, Media & Entertainment in Illinois?
Foosland has the Highest Percentage of Population Employed in Arts, Media & Entertainment in Illinois with 15.4%.
What is the Percentage of Population Employed in Arts, Media & Entertainment in the State of Illinois?
Percentage of Population Employed in Arts, Media & Entertainment in Illinois is 1.9%.
What is the Percentage of Population Employed in Arts, Media & Entertainment in the United States?
Percentage of Population Employed in Arts, Media & Entertainment in the United States is 2.1%.