Cities with the Highest Percentage of Population Employed in Arts, Media & Entertainment in Kentucky
RELATED REPORTS & OPTIONS
Arts, Media & Entertainment
Kentucky
Compare Cities
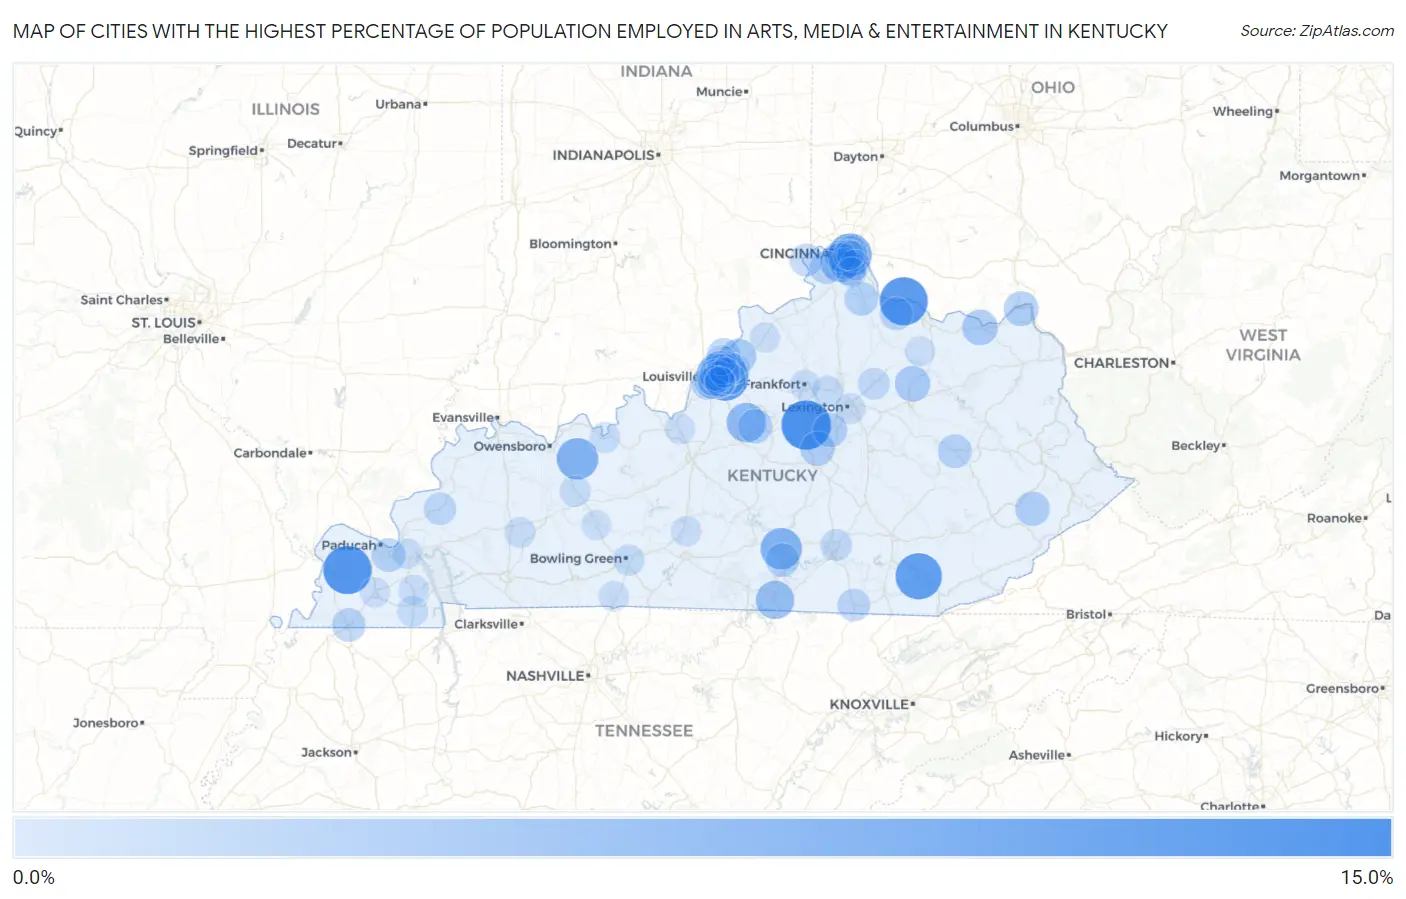
Map of Cities with the Highest Percentage of Population Employed in Arts, Media & Entertainment in Kentucky
0.0%
15.0%
Cities with the Highest Percentage of Population Employed in Arts, Media & Entertainment in Kentucky
| City | % Employed | vs State | vs National | |
| 1. | Salvisa | 14.2% | 1.4%(+12.8)#1 | 2.1%(+12.1)#211 |
| 2. | Cunningham | 13.3% | 1.4%(+12.0)#2 | 2.1%(+11.3)#235 |
| 3. | Augusta | 13.1% | 1.4%(+11.7)#3 | 2.1%(+11.0)#243 |
| 4. | Wildwood | 12.3% | 1.4%(+10.9)#4 | 2.1%(+10.2)#273 |
| 5. | Barbourville | 12.0% | 1.4%(+10.7)#5 | 2.1%(+9.98)#283 |
| 6. | Woodlawn | 10.1% | 1.4%(+8.71)#6 | 2.1%(+8.03)#376 |
| 7. | Whitesville | 9.0% | 1.4%(+7.63)#7 | 2.1%(+6.95)#463 |
| 8. | Russell Springs | 8.9% | 1.4%(+7.54)#8 | 2.1%(+6.86)#473 |
| 9. | Crossgate | 8.9% | 1.4%(+7.53)#9 | 2.1%(+6.85)#475 |
| 10. | Pleasant Ridge | 7.8% | 1.4%(+6.37)#10 | 2.1%(+5.69)#634 |
| 11. | Fairfield | 7.6% | 1.4%(+6.20)#11 | 2.1%(+5.51)#670 |
| 12. | Lakeside Park | 7.3% | 1.4%(+5.92)#12 | 2.1%(+5.24)#725 |
| 13. | Albany | 7.1% | 1.4%(+5.73)#13 | 2.1%(+5.05)#772 |
| 14. | Ten Broeck | 6.5% | 1.4%(+5.07)#14 | 2.1%(+4.39)#925 |
| 15. | Richlawn | 6.4% | 1.4%(+4.98)#15 | 2.1%(+4.30)#948 |
| 16. | Windy Hills | 5.8% | 1.4%(+4.46)#16 | 2.1%(+3.78)#1,119 |
| 17. | Thornhill | 5.3% | 1.4%(+3.94)#17 | 2.1%(+3.26)#1,357 |
| 18. | Sharpsburg | 5.3% | 1.4%(+3.92)#18 | 2.1%(+3.24)#1,362 |
| 19. | Vanceburg | 5.3% | 1.4%(+3.90)#19 | 2.1%(+3.22)#1,369 |
| 20. | Druid Hills | 5.2% | 1.4%(+3.82)#20 | 2.1%(+3.14)#1,416 |
| 21. | Strathmoor Village | 5.2% | 1.4%(+3.80)#21 | 2.1%(+3.12)#1,424 |
| 22. | Buckner | 5.0% | 1.4%(+3.59)#22 | 2.1%(+2.91)#1,544 |
| 23. | Fairview | 4.9% | 1.4%(+3.56)#23 | 2.1%(+2.88)#1,565 |
| 24. | Woodlawn Park | 4.9% | 1.4%(+3.51)#24 | 2.1%(+2.83)#1,583 |
| 25. | South Shore | 4.8% | 1.4%(+3.44)#25 | 2.1%(+2.75)#1,647 |
| 26. | Burgin | 4.7% | 1.4%(+3.28)#26 | 2.1%(+2.60)#1,744 |
| 27. | Pippa Passes | 4.6% | 1.4%(+3.24)#27 | 2.1%(+2.56)#1,771 |
| 28. | Bloomfield | 4.6% | 1.4%(+3.23)#28 | 2.1%(+2.55)#1,776 |
| 29. | Wilmore | 4.6% | 1.4%(+3.21)#29 | 2.1%(+2.53)#1,781 |
| 30. | Hickory Hill | 4.4% | 1.4%(+3.03)#30 | 2.1%(+2.35)#1,915 |
| 31. | Bellemeade | 4.3% | 1.4%(+2.95)#31 | 2.1%(+2.27)#1,984 |
| 32. | Campton | 4.2% | 1.4%(+2.79)#32 | 2.1%(+2.11)#2,116 |
| 33. | Reidland | 4.2% | 1.4%(+2.78)#33 | 2.1%(+2.10)#2,123 |
| 34. | Butler | 4.1% | 1.4%(+2.74)#34 | 2.1%(+2.06)#2,148 |
| 35. | Fulton | 4.1% | 1.4%(+2.72)#35 | 2.1%(+2.04)#2,169 |
| 36. | Jamestown | 4.0% | 1.4%(+2.65)#36 | 2.1%(+1.97)#2,234 |
| 37. | Goshen | 4.0% | 1.4%(+2.63)#37 | 2.1%(+1.95)#2,255 |
| 38. | Brooksville | 3.8% | 1.4%(+2.41)#38 | 2.1%(+1.73)#2,489 |
| 39. | Oakbrook | 3.8% | 1.4%(+2.40)#39 | 2.1%(+1.71)#2,504 |
| 40. | Moorland | 3.7% | 1.4%(+2.36)#40 | 2.1%(+1.68)#2,550 |
| 41. | Petersburg | 3.7% | 1.4%(+2.32)#41 | 2.1%(+1.64)#2,599 |
| 42. | Green Spring | 3.7% | 1.4%(+2.32)#42 | 2.1%(+1.64)#2,600 |
| 43. | Cambridge | 3.6% | 1.4%(+2.22)#43 | 2.1%(+1.54)#2,708 |
| 44. | Pine Knot | 3.5% | 1.4%(+2.15)#44 | 2.1%(+1.47)#2,812 |
| 45. | Wellington | 3.5% | 1.4%(+2.11)#45 | 2.1%(+1.43)#2,869 |
| 46. | Marion | 3.5% | 1.4%(+2.09)#46 | 2.1%(+1.41)#2,891 |
| 47. | Mockingbird Valley | 3.4% | 1.4%(+2.07)#47 | 2.1%(+1.39)#2,929 |
| 48. | Goose Creek | 3.4% | 1.4%(+2.01)#48 | 2.1%(+1.33)#3,006 |
| 49. | Glenview Hills | 3.3% | 1.4%(+1.92)#49 | 2.1%(+1.24)#3,160 |
| 50. | Woodland Hills | 3.2% | 1.4%(+1.82)#50 | 2.1%(+1.14)#3,349 |
| 51. | Audubon Park | 3.2% | 1.4%(+1.81)#51 | 2.1%(+1.13)#3,358 |
| 52. | Manor Creek | 3.2% | 1.4%(+1.80)#52 | 2.1%(+1.12)#3,375 |
| 53. | Hills And Dales | 3.2% | 1.4%(+1.79)#53 | 2.1%(+1.11)#3,394 |
| 54. | Graymoor Devondale | 3.1% | 1.4%(+1.77)#54 | 2.1%(+1.09)#3,440 |
| 55. | Paris | 3.0% | 1.4%(+1.62)#55 | 2.1%(+0.943)#3,697 |
| 56. | Somerset | 3.0% | 1.4%(+1.61)#56 | 2.1%(+0.925)#3,736 |
| 57. | Brownsboro Village | 3.0% | 1.4%(+1.60)#57 | 2.1%(+0.915)#3,759 |
| 58. | Old Brownsboro Place | 2.9% | 1.4%(+1.51)#58 | 2.1%(+0.829)#3,940 |
| 59. | Lyndon | 2.9% | 1.4%(+1.51)#59 | 2.1%(+0.825)#3,951 |
| 60. | Norbourne Estates | 2.8% | 1.4%(+1.46)#60 | 2.1%(+0.783)#4,061 |
| 61. | St Matthews | 2.8% | 1.4%(+1.44)#61 | 2.1%(+0.762)#4,112 |
| 62. | Dayton | 2.8% | 1.4%(+1.43)#62 | 2.1%(+0.752)#4,137 |
| 63. | Glenview | 2.8% | 1.4%(+1.41)#63 | 2.1%(+0.727)#4,200 |
| 64. | Covington | 2.8% | 1.4%(+1.38)#64 | 2.1%(+0.696)#4,273 |
| 65. | Bowling Green | 2.7% | 1.4%(+1.35)#65 | 2.1%(+0.669)#4,340 |
| 66. | Bromley | 2.7% | 1.4%(+1.32)#66 | 2.1%(+0.636)#4,434 |
| 67. | Hartford | 2.6% | 1.4%(+1.25)#67 | 2.1%(+0.575)#4,586 |
| 68. | Midway | 2.6% | 1.4%(+1.25)#68 | 2.1%(+0.568)#4,609 |
| 69. | Plantation | 2.6% | 1.4%(+1.23)#69 | 2.1%(+0.548)#4,652 |
| 70. | Murray | 2.5% | 1.4%(+1.17)#70 | 2.1%(+0.485)#4,837 |
| 71. | Norwood | 2.5% | 1.4%(+1.16)#71 | 2.1%(+0.477)#4,858 |
| 72. | Middletown | 2.5% | 1.4%(+1.12)#72 | 2.1%(+0.437)#4,993 |
| 73. | Beechwood Village | 2.5% | 1.4%(+1.12)#73 | 2.1%(+0.435)#4,998 |
| 74. | Cloverport | 2.5% | 1.4%(+1.10)#74 | 2.1%(+0.418)#5,043 |
| 75. | White Plains | 2.5% | 1.4%(+1.10)#75 | 2.1%(+0.418)#5,045 |
| 76. | Seneca Gardens | 2.4% | 1.4%(+1.06)#76 | 2.1%(+0.378)#5,176 |
| 77. | Bellewood | 2.4% | 1.4%(+1.06)#77 | 2.1%(+0.378)#5,181 |
| 78. | Lexington | 2.4% | 1.4%(+1.05)#78 | 2.1%(+0.373)#5,197 |
| 79. | Brownsboro Farm | 2.4% | 1.4%(+1.04)#79 | 2.1%(+0.361)#5,229 |
| 80. | Pewee Valley | 2.3% | 1.4%(+0.927)#80 | 2.1%(+0.247)#5,602 |
| 81. | Fort Thomas | 2.3% | 1.4%(+0.913)#81 | 2.1%(+0.233)#5,641 |
| 82. | Fort Knox | 2.3% | 1.4%(+0.900)#82 | 2.1%(+0.220)#5,684 |
| 83. | Frankfort | 2.3% | 1.4%(+0.882)#83 | 2.1%(+0.202)#5,763 |
| 84. | Hardin | 2.2% | 1.4%(+0.867)#84 | 2.1%(+0.186)#5,812 |
| 85. | Coldstream | 2.2% | 1.4%(+0.865)#85 | 2.1%(+0.185)#5,820 |
| 86. | Mayfield | 2.2% | 1.4%(+0.839)#86 | 2.1%(+0.158)#5,909 |
| 87. | Franklin | 2.2% | 1.4%(+0.827)#87 | 2.1%(+0.147)#5,951 |
| 88. | Horse Cave | 2.2% | 1.4%(+0.805)#88 | 2.1%(+0.125)#6,026 |
| 89. | River Bluff | 2.2% | 1.4%(+0.801)#89 | 2.1%(+0.121)#6,035 |
| 90. | Cold Spring | 2.2% | 1.4%(+0.794)#90 | 2.1%(+0.114)#6,054 |
| 91. | Houston Acres | 2.2% | 1.4%(+0.770)#91 | 2.1%(+0.090)#6,150 |
| 92. | Ryland Heights | 2.1% | 1.4%(+0.725)#92 | 2.1%(+0.044)#6,325 |
| 93. | Kingsley | 2.1% | 1.4%(+0.720)#93 | 2.1%(+0.040)#6,352 |
| 94. | Calvert City | 2.1% | 1.4%(+0.711)#94 | 2.1%(+0.031)#6,380 |
| 95. | Campbellsburg | 2.1% | 1.4%(+0.707)#95 | 2.1%(+0.027)#6,395 |
| 96. | Newport | 2.0% | 1.4%(+0.662)#96 | 2.1%(-0.018)#6,575 |
| 97. | Morgantown | 2.0% | 1.4%(+0.653)#97 | 2.1%(-0.027)#6,614 |
| 98. | Meadowbrook Farm | 2.0% | 1.4%(+0.619)#98 | 2.1%(-0.061)#6,750 |
| 99. | Lincolnshire | 2.0% | 1.4%(+0.619)#99 | 2.1%(-0.061)#6,751 |
| 100. | Ewing | 2.0% | 1.4%(+0.600)#100 | 2.1%(-0.081)#6,823 |
Common Questions
What are the Top 10 Cities with the Highest Percentage of Population Employed in Arts, Media & Entertainment in Kentucky?
Top 10 Cities with the Highest Percentage of Population Employed in Arts, Media & Entertainment in Kentucky are:
#1
14.2%
#2
13.3%
#3
13.1%
#4
12.3%
#5
12.0%
#6
10.1%
#7
9.0%
#8
8.9%
#9
8.9%
#10
7.6%
What city has the Highest Percentage of Population Employed in Arts, Media & Entertainment in Kentucky?
Salvisa has the Highest Percentage of Population Employed in Arts, Media & Entertainment in Kentucky with 14.2%.
What is the Percentage of Population Employed in Arts, Media & Entertainment in the State of Kentucky?
Percentage of Population Employed in Arts, Media & Entertainment in Kentucky is 1.4%.
What is the Percentage of Population Employed in Arts, Media & Entertainment in the United States?
Percentage of Population Employed in Arts, Media & Entertainment in the United States is 2.1%.