Cities with the Highest Percentage of Population Employed in Arts, Media & Entertainment in New York
RELATED REPORTS & OPTIONS
Arts, Media & Entertainment
New York
Compare Cities
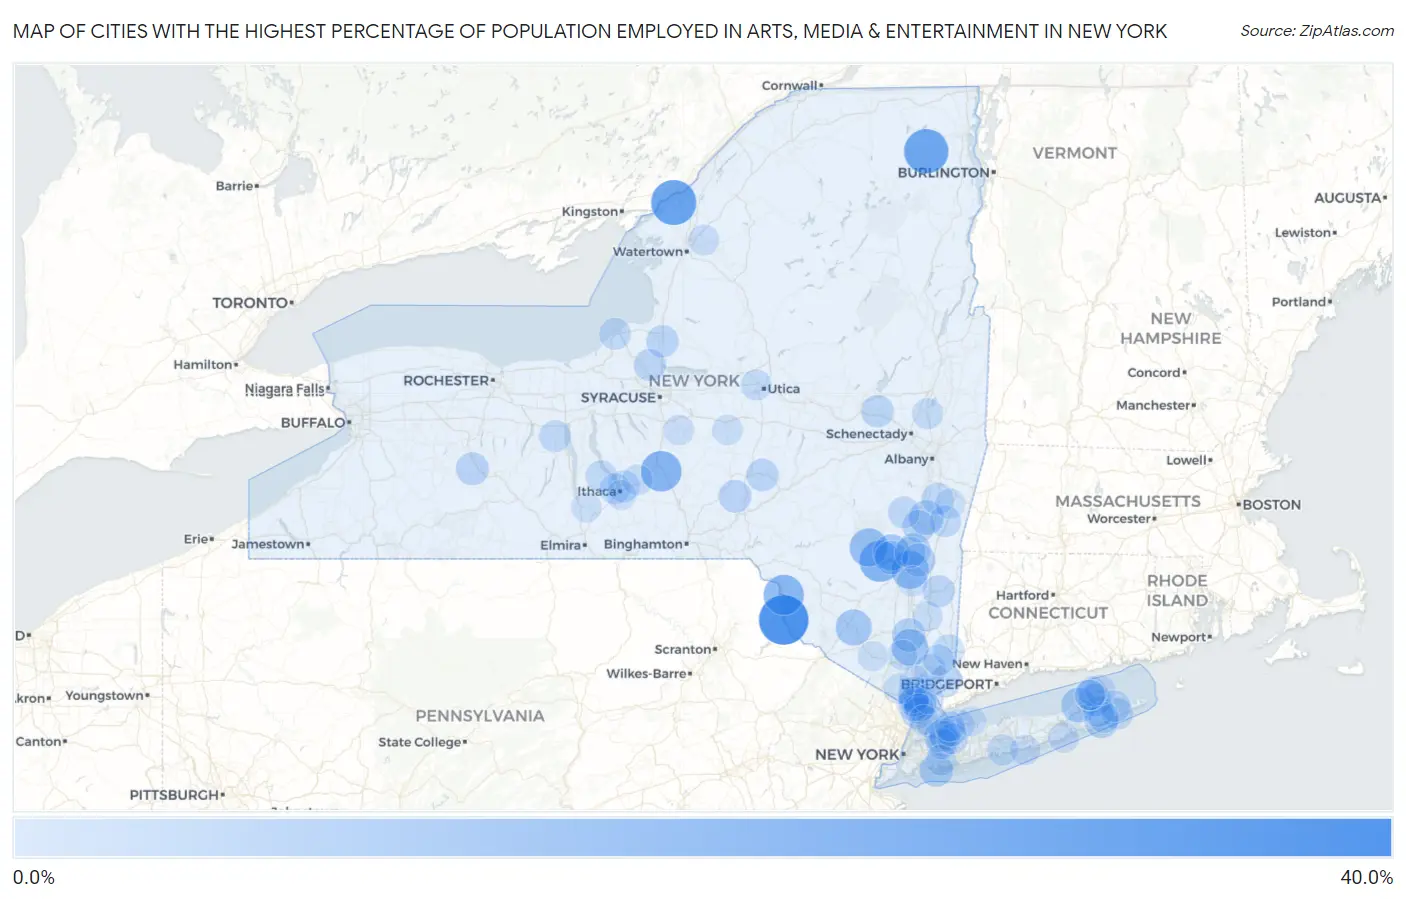
Map of Cities with the Highest Percentage of Population Employed in Arts, Media & Entertainment in New York
0.0%
40.0%
Cities with the Highest Percentage of Population Employed in Arts, Media & Entertainment in New York
| City | % Employed | vs State | vs National | |
| 1. | Narrowsburg | 31.9% | 3.3%(+28.6)#1 | 2.1%(+29.8)#43 |
| 2. | Thousand Island Park | 25.7% | 3.3%(+22.5)#2 | 2.1%(+23.7)#66 |
| 3. | Redford | 24.7% | 3.3%(+21.4)#3 | 2.1%(+22.6)#73 |
| 4. | Shokan | 19.8% | 3.3%(+16.5)#4 | 2.1%(+17.8)#111 |
| 5. | Blodgett Mills | 19.4% | 3.3%(+16.1)#5 | 2.1%(+17.4)#116 |
| 6. | Callicoon | 19.0% | 3.3%(+15.7)#6 | 2.1%(+16.9)#119 |
| 7. | Phoenicia | 16.2% | 3.3%(+12.9)#7 | 2.1%(+14.1)#156 |
| 8. | Rhinecliff | 15.7% | 3.3%(+12.4)#8 | 2.1%(+13.6)#165 |
| 9. | Cold Spring | 13.7% | 3.3%(+10.4)#9 | 2.1%(+11.7)#222 |
| 10. | Woodstock | 13.5% | 3.3%(+10.2)#10 | 2.1%(+11.4)#230 |
| 11. | New Baltimore | 13.4% | 3.3%(+10.1)#11 | 2.1%(+11.3)#234 |
| 12. | Bloomingburg | 13.1% | 3.3%(+9.86)#12 | 2.1%(+11.1)#242 |
| 13. | Eldred | 12.9% | 3.3%(+9.59)#13 | 2.1%(+10.8)#250 |
| 14. | Peconic | 11.8% | 3.3%(+8.51)#14 | 2.1%(+9.72)#295 |
| 15. | Athens | 11.2% | 3.3%(+7.91)#15 | 2.1%(+9.13)#317 |
| 16. | Mountain Dale | 11.1% | 3.3%(+7.83)#16 | 2.1%(+9.05)#319 |
| 17. | Nazareth College | 10.8% | 3.3%(+7.57)#17 | 2.1%(+8.78)#334 |
| 18. | Sagaponack | 10.2% | 3.3%(+6.96)#18 | 2.1%(+8.18)#366 |
| 19. | Upper Nyack | 10.2% | 3.3%(+6.90)#19 | 2.1%(+8.12)#369 |
| 20. | Lawrence | 10.1% | 3.3%(+6.83)#20 | 2.1%(+8.04)#373 |
| 21. | Tivoli | 9.9% | 3.3%(+6.59)#21 | 2.1%(+7.81)#396 |
| 22. | Beacon | 9.8% | 3.3%(+6.51)#22 | 2.1%(+7.72)#405 |
| 23. | South Lansing | 9.6% | 3.3%(+6.35)#23 | 2.1%(+7.57)#414 |
| 24. | West Hurley | 9.6% | 3.3%(+6.29)#24 | 2.1%(+7.51)#419 |
| 25. | Red Hook | 9.3% | 3.3%(+6.03)#25 | 2.1%(+7.24)#438 |
| 26. | Hastings On Hudson | 9.1% | 3.3%(+5.83)#26 | 2.1%(+7.05)#453 |
| 27. | Barryville | 9.1% | 3.3%(+5.81)#27 | 2.1%(+7.03)#457 |
| 28. | Byersville | 9.1% | 3.3%(+5.81)#28 | 2.1%(+7.03)#459 |
| 29. | Tarrytown | 9.0% | 3.3%(+5.70)#29 | 2.1%(+6.92)#468 |
| 30. | Shelter Island Heights | 8.9% | 3.3%(+5.59)#30 | 2.1%(+6.81)#477 |
| 31. | Guilford | 8.9% | 3.3%(+5.58)#31 | 2.1%(+6.80)#478 |
| 32. | Morris | 8.7% | 3.3%(+5.44)#32 | 2.1%(+6.65)#492 |
| 33. | Larchmont | 8.6% | 3.3%(+5.31)#33 | 2.1%(+6.53)#510 |
| 34. | Irvington | 8.6% | 3.3%(+5.31)#34 | 2.1%(+6.52)#512 |
| 35. | Wassaic | 8.5% | 3.3%(+5.25)#35 | 2.1%(+6.47)#521 |
| 36. | Fort Johnson | 8.5% | 3.3%(+5.20)#36 | 2.1%(+6.41)#526 |
| 37. | Parish | 8.4% | 3.3%(+5.11)#37 | 2.1%(+6.33)#538 |
| 38. | Piermont | 8.3% | 3.3%(+5.02)#38 | 2.1%(+6.24)#551 |
| 39. | Catskill | 8.3% | 3.3%(+4.99)#39 | 2.1%(+6.20)#554 |
| 40. | Millbrook | 8.1% | 3.3%(+4.78)#40 | 2.1%(+6.00)#580 |
| 41. | Sand Ridge | 8.0% | 3.3%(+4.73)#41 | 2.1%(+5.95)#592 |
| 42. | Bedford | 7.9% | 3.3%(+4.64)#42 | 2.1%(+5.85)#608 |
| 43. | Yorktown Heights | 7.8% | 3.3%(+4.54)#43 | 2.1%(+5.76)#619 |
| 44. | Northeast Ithaca | 7.8% | 3.3%(+4.52)#44 | 2.1%(+5.74)#624 |
| 45. | Kinderhook | 7.8% | 3.3%(+4.48)#45 | 2.1%(+5.70)#630 |
| 46. | Port Washington | 7.8% | 3.3%(+4.47)#46 | 2.1%(+5.69)#633 |
| 47. | Philmont | 7.6% | 3.3%(+4.33)#47 | 2.1%(+5.54)#664 |
| 48. | Cairo | 7.5% | 3.3%(+4.27)#48 | 2.1%(+5.49)#673 |
| 49. | Hall | 7.5% | 3.3%(+4.26)#49 | 2.1%(+5.48)#678 |
| 50. | Suny Oswego | 7.5% | 3.3%(+4.23)#50 | 2.1%(+5.44)#685 |
| 51. | Trumansburg | 7.4% | 3.3%(+4.12)#51 | 2.1%(+5.34)#708 |
| 52. | Akwesasne | 7.4% | 3.3%(+4.08)#52 | 2.1%(+5.29)#712 |
| 53. | Brewster | 7.2% | 3.3%(+3.93)#53 | 2.1%(+5.14)#746 |
| 54. | Amagansett | 7.2% | 3.3%(+3.89)#54 | 2.1%(+5.10)#754 |
| 55. | Springs | 7.0% | 3.3%(+3.73)#55 | 2.1%(+4.95)#786 |
| 56. | Roslyn | 7.0% | 3.3%(+3.70)#56 | 2.1%(+4.92)#790 |
| 57. | Glasco | 7.0% | 3.3%(+3.69)#57 | 2.1%(+4.90)#797 |
| 58. | Rosendale | 6.9% | 3.3%(+3.57)#58 | 2.1%(+4.79)#826 |
| 59. | Heritage Hills | 6.8% | 3.3%(+3.54)#59 | 2.1%(+4.76)#834 |
| 60. | Sag Harbor | 6.8% | 3.3%(+3.51)#60 | 2.1%(+4.73)#838 |
| 61. | Oakdale | 6.7% | 3.3%(+3.47)#61 | 2.1%(+4.69)#845 |
| 62. | Northwest Ithaca | 6.7% | 3.3%(+3.46)#62 | 2.1%(+4.67)#847 |
| 63. | Centre Island | 6.7% | 3.3%(+3.39)#63 | 2.1%(+4.61)#860 |
| 64. | Whitesboro | 6.6% | 3.3%(+3.30)#64 | 2.1%(+4.51)#886 |
| 65. | Round Lake | 6.5% | 3.3%(+3.27)#65 | 2.1%(+4.49)#891 |
| 66. | Sea Cliff | 6.5% | 3.3%(+3.26)#66 | 2.1%(+4.48)#897 |
| 67. | Glenwood Landing | 6.5% | 3.3%(+3.23)#67 | 2.1%(+4.44)#907 |
| 68. | Wainscott | 6.5% | 3.3%(+3.18)#68 | 2.1%(+4.40)#916 |
| 69. | North Hills | 6.4% | 3.3%(+3.15)#69 | 2.1%(+4.37)#930 |
| 70. | Malverne | 6.3% | 3.3%(+3.06)#70 | 2.1%(+4.28)#954 |
| 71. | Brookville | 6.3% | 3.3%(+3.06)#71 | 2.1%(+4.28)#955 |
| 72. | Nyack | 6.3% | 3.3%(+3.01)#72 | 2.1%(+4.23)#969 |
| 73. | Hamilton College | 6.3% | 3.3%(+3.00)#73 | 2.1%(+4.22)#970 |
| 74. | Freeville | 6.2% | 3.3%(+2.97)#74 | 2.1%(+4.19)#977 |
| 75. | Croton On Hudson | 6.2% | 3.3%(+2.94)#75 | 2.1%(+4.15)#988 |
| 76. | Fort Drum | 6.1% | 3.3%(+2.86)#76 | 2.1%(+4.08)#1,010 |
| 77. | Greenport West | 6.1% | 3.3%(+2.81)#77 | 2.1%(+4.03)#1,023 |
| 78. | Vassar College | 6.1% | 3.3%(+2.80)#78 | 2.1%(+4.01)#1,026 |
| 79. | Hamilton | 6.1% | 3.3%(+2.79)#79 | 2.1%(+4.01)#1,027 |
| 80. | Matinecock | 6.0% | 3.3%(+2.71)#80 | 2.1%(+3.93)#1,057 |
| 81. | Quogue | 6.0% | 3.3%(+2.71)#81 | 2.1%(+3.93)#1,058 |
| 82. | Bellport | 6.0% | 3.3%(+2.71)#82 | 2.1%(+3.92)#1,060 |
| 83. | Staatsburg | 6.0% | 3.3%(+2.71)#83 | 2.1%(+3.92)#1,061 |
| 84. | Valhalla | 5.9% | 3.3%(+2.65)#84 | 2.1%(+3.87)#1,081 |
| 85. | Fabius | 5.9% | 3.3%(+2.60)#85 | 2.1%(+3.82)#1,105 |
| 86. | Lattingtown | 5.8% | 3.3%(+2.56)#86 | 2.1%(+3.78)#1,122 |
| 87. | Orient | 5.8% | 3.3%(+2.50)#87 | 2.1%(+3.71)#1,136 |
| 88. | Hillside Lake | 5.8% | 3.3%(+2.48)#88 | 2.1%(+3.70)#1,144 |
| 89. | Grand View On Hudson | 5.7% | 3.3%(+2.47)#89 | 2.1%(+3.69)#1,152 |
| 90. | New Hempstead | 5.7% | 3.3%(+2.46)#90 | 2.1%(+3.68)#1,155 |
| 91. | West Point | 5.7% | 3.3%(+2.45)#91 | 2.1%(+3.66)#1,159 |
| 92. | Chester | 5.7% | 3.3%(+2.41)#92 | 2.1%(+3.63)#1,171 |
| 93. | Chatham | 5.6% | 3.3%(+2.35)#93 | 2.1%(+3.56)#1,194 |
| 94. | Dobbs Ferry | 5.6% | 3.3%(+2.32)#94 | 2.1%(+3.54)#1,208 |
| 95. | Eatons Neck | 5.6% | 3.3%(+2.29)#95 | 2.1%(+3.51)#1,219 |
| 96. | Bronxville | 5.6% | 3.3%(+2.27)#96 | 2.1%(+3.49)#1,239 |
| 97. | East Marion | 5.5% | 3.3%(+2.27)#97 | 2.1%(+3.49)#1,241 |
| 98. | South Hill | 5.5% | 3.3%(+2.18)#98 | 2.1%(+3.40)#1,279 |
| 99. | Greenport | 5.5% | 3.3%(+2.18)#99 | 2.1%(+3.39)#1,286 |
| 100. | Odessa | 5.4% | 3.3%(+2.17)#100 | 2.1%(+3.39)#1,288 |
Common Questions
What are the Top 10 Cities with the Highest Percentage of Population Employed in Arts, Media & Entertainment in New York?
Top 10 Cities with the Highest Percentage of Population Employed in Arts, Media & Entertainment in New York are:
#1
31.9%
#2
25.7%
#3
24.7%
#4
19.8%
#5
19.4%
#6
19.0%
#7
16.2%
#8
15.7%
#9
13.7%
#10
13.5%
What city has the Highest Percentage of Population Employed in Arts, Media & Entertainment in New York?
Narrowsburg has the Highest Percentage of Population Employed in Arts, Media & Entertainment in New York with 31.9%.
What is the Percentage of Population Employed in Arts, Media & Entertainment in the State of New York?
Percentage of Population Employed in Arts, Media & Entertainment in New York is 3.3%.
What is the Percentage of Population Employed in Arts, Media & Entertainment in the United States?
Percentage of Population Employed in Arts, Media & Entertainment in the United States is 2.1%.