Cities with the Highest Percentage of Population Employed in Arts, Media & Entertainment in Alabama
RELATED REPORTS & OPTIONS
Arts, Media & Entertainment
Alabama
Compare Cities
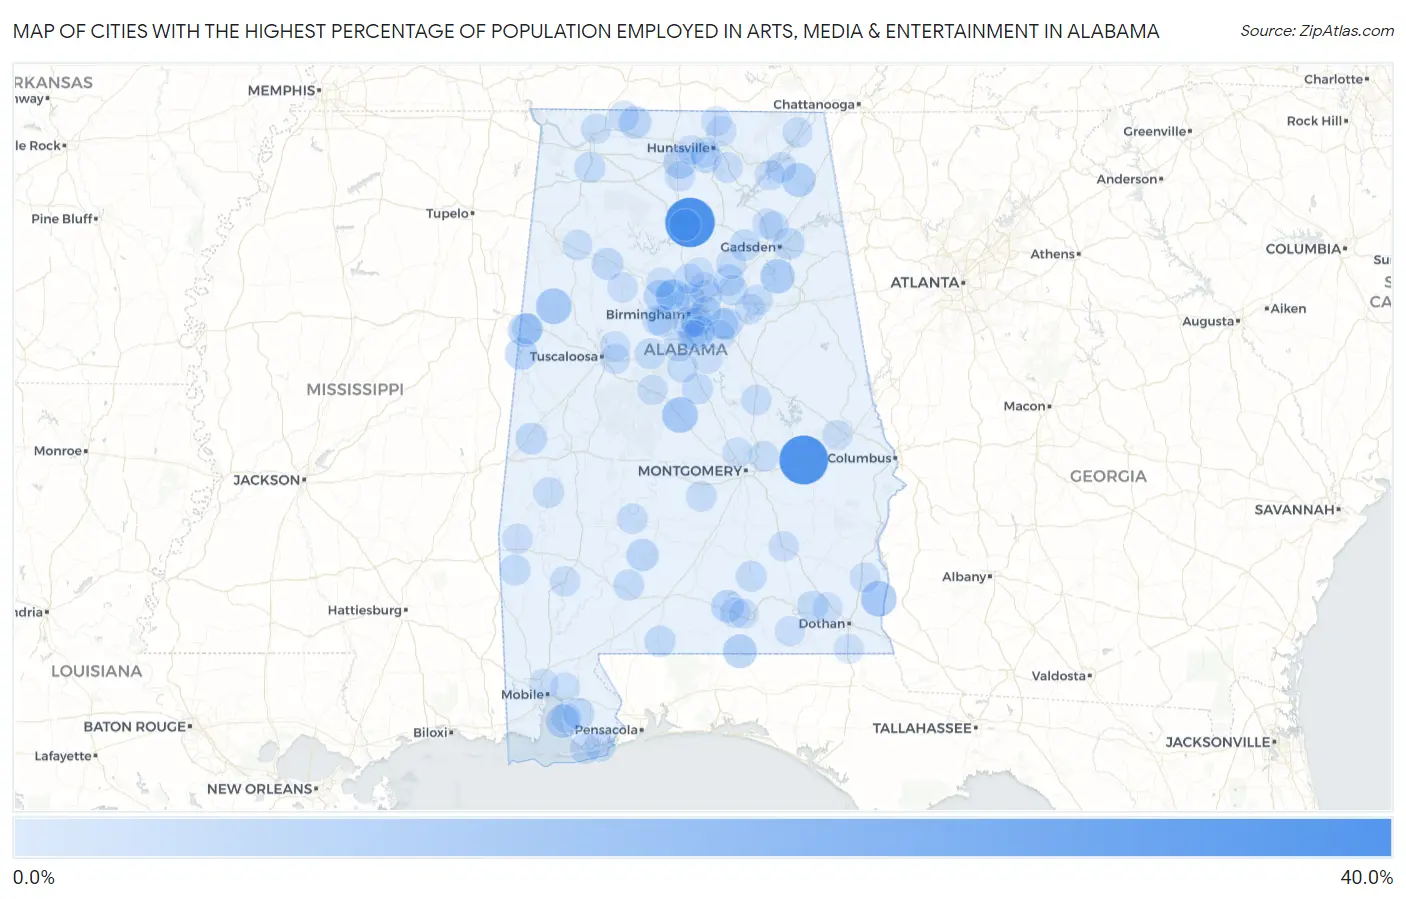
Map of Cities with the Highest Percentage of Population Employed in Arts, Media & Entertainment in Alabama
0.0%
40.0%
Cities with the Highest Percentage of Population Employed in Arts, Media & Entertainment in Alabama
| City | % Employed | vs State | vs National | |
| 1. | East Point | 31.5% | 1.3%(+30.3)#1 | 2.1%(+29.5)#45 |
| 2. | Franklin | 30.4% | 1.3%(+29.1)#2 | 2.1%(+28.3)#46 |
| 3. | Maplesville | 9.9% | 1.3%(+8.68)#3 | 2.1%(+7.88)#391 |
| 4. | Kennedy | 9.9% | 1.3%(+8.64)#4 | 2.1%(+7.84)#393 |
| 5. | Haleburg | 9.8% | 1.3%(+8.58)#5 | 2.1%(+7.78)#400 |
| 6. | Ohatchee | 8.2% | 1.3%(+6.91)#6 | 2.1%(+6.11)#566 |
| 7. | Rainsville | 7.2% | 1.3%(+5.99)#7 | 2.1%(+5.18)#740 |
| 8. | Lockhart | 7.1% | 1.3%(+5.89)#8 | 2.1%(+5.08)#760 |
| 9. | Cardiff | 7.1% | 1.3%(+5.89)#9 | 2.1%(+5.08)#765 |
| 10. | Macedonia | 6.9% | 1.3%(+5.64)#10 | 2.1%(+4.84)#813 |
| 11. | Point Clear | 6.3% | 1.3%(+5.04)#11 | 2.1%(+4.23)#967 |
| 12. | Mooresville | 5.7% | 1.3%(+4.46)#12 | 2.1%(+3.65)#1,164 |
| 13. | West Jefferson | 5.6% | 1.3%(+4.30)#13 | 2.1%(+3.49)#1,229 |
| 14. | Heath | 5.5% | 1.3%(+4.24)#14 | 2.1%(+3.43)#1,266 |
| 15. | Anderson | 5.4% | 1.3%(+4.18)#15 | 2.1%(+3.37)#1,297 |
| 16. | Beatrice | 5.3% | 1.3%(+4.01)#16 | 2.1%(+3.20)#1,387 |
| 17. | Pickensville | 5.1% | 1.3%(+3.83)#17 | 2.1%(+3.02)#1,470 |
| 18. | Grayson Valley | 4.7% | 1.3%(+3.41)#18 | 2.1%(+2.60)#1,743 |
| 19. | Sterrett | 4.6% | 1.3%(+3.33)#19 | 2.1%(+2.53)#1,787 |
| 20. | Carbon Hill | 4.5% | 1.3%(+3.27)#20 | 2.1%(+2.46)#1,840 |
| 21. | Tidmore Bend | 4.3% | 1.3%(+3.05)#21 | 2.1%(+2.25)#1,991 |
| 22. | Livingston | 4.2% | 1.3%(+2.95)#22 | 2.1%(+2.15)#2,068 |
| 23. | Mountain Brook | 4.1% | 1.3%(+2.88)#23 | 2.1%(+2.07)#2,141 |
| 24. | Homewood | 4.1% | 1.3%(+2.80)#24 | 2.1%(+1.99)#2,208 |
| 25. | Cullman | 3.9% | 1.3%(+2.67)#25 | 2.1%(+1.86)#2,340 |
| 26. | Springville | 3.8% | 1.3%(+2.54)#26 | 2.1%(+1.74)#2,469 |
| 27. | East Brewton | 3.7% | 1.3%(+2.45)#27 | 2.1%(+1.65)#2,589 |
| 28. | Altoona | 3.6% | 1.3%(+2.38)#28 | 2.1%(+1.58)#2,673 |
| 29. | Silverhill | 3.6% | 1.3%(+2.37)#29 | 2.1%(+1.57)#2,685 |
| 30. | Concord | 3.6% | 1.3%(+2.32)#30 | 2.1%(+1.52)#2,739 |
| 31. | Jemison | 3.6% | 1.3%(+2.31)#31 | 2.1%(+1.51)#2,761 |
| 32. | Redstone Arsenal | 3.4% | 1.3%(+2.15)#32 | 2.1%(+1.35)#2,979 |
| 33. | Ethelsville | 3.4% | 1.3%(+2.13)#33 | 2.1%(+1.33)#3,008 |
| 34. | Fort Rucker | 3.3% | 1.3%(+2.02)#34 | 2.1%(+1.22)#3,189 |
| 35. | Vandiver | 3.3% | 1.3%(+2.00)#35 | 2.1%(+1.20)#3,234 |
| 36. | Littleville | 3.2% | 1.3%(+1.95)#36 | 2.1%(+1.15)#3,329 |
| 37. | Woodstock | 3.2% | 1.3%(+1.92)#37 | 2.1%(+1.12)#3,386 |
| 38. | Millry | 3.1% | 1.3%(+1.87)#38 | 2.1%(+1.06)#3,476 |
| 39. | Monroeville | 3.1% | 1.3%(+1.86)#39 | 2.1%(+1.06)#3,498 |
| 40. | Brantley | 3.1% | 1.3%(+1.82)#40 | 2.1%(+1.02)#3,560 |
| 41. | Fultondale | 3.1% | 1.3%(+1.82)#41 | 2.1%(+1.01)#3,566 |
| 42. | Rock Creek | 3.0% | 1.3%(+1.72)#42 | 2.1%(+0.918)#3,753 |
| 43. | Section | 3.0% | 1.3%(+1.69)#43 | 2.1%(+0.890)#3,811 |
| 44. | Lexington | 2.9% | 1.3%(+1.69)#44 | 2.1%(+0.889)#3,815 |
| 45. | Mccalla | 2.9% | 1.3%(+1.68)#45 | 2.1%(+0.878)#3,841 |
| 46. | Orange Beach | 2.8% | 1.3%(+1.57)#46 | 2.1%(+0.764)#4,104 |
| 47. | Fairhope | 2.8% | 1.3%(+1.57)#47 | 2.1%(+0.764)#4,110 |
| 48. | Odenville | 2.8% | 1.3%(+1.51)#48 | 2.1%(+0.706)#4,245 |
| 49. | Indian Springs Village | 2.7% | 1.3%(+1.48)#49 | 2.1%(+0.674)#4,322 |
| 50. | Pennington | 2.7% | 1.3%(+1.45)#50 | 2.1%(+0.642)#4,419 |
| 51. | Mosses | 2.7% | 1.3%(+1.41)#51 | 2.1%(+0.606)#4,508 |
| 52. | Rockford | 2.6% | 1.3%(+1.36)#52 | 2.1%(+0.557)#4,634 |
| 53. | Gulf Shores | 2.6% | 1.3%(+1.36)#53 | 2.1%(+0.553)#4,644 |
| 54. | Montevallo | 2.6% | 1.3%(+1.34)#54 | 2.1%(+0.541)#4,668 |
| 55. | Camden | 2.6% | 1.3%(+1.33)#55 | 2.1%(+0.529)#4,711 |
| 56. | Helena | 2.6% | 1.3%(+1.32)#56 | 2.1%(+0.513)#4,761 |
| 57. | Redland | 2.6% | 1.3%(+1.31)#57 | 2.1%(+0.511)#4,766 |
| 58. | Pinson | 2.5% | 1.3%(+1.24)#58 | 2.1%(+0.434)#5,003 |
| 59. | Riverside | 2.5% | 1.3%(+1.22)#59 | 2.1%(+0.421)#5,033 |
| 60. | Sanford | 2.5% | 1.3%(+1.21)#60 | 2.1%(+0.408)#5,072 |
| 61. | Oakman | 2.5% | 1.3%(+1.20)#61 | 2.1%(+0.398)#5,109 |
| 62. | Sardis City | 2.4% | 1.3%(+1.18)#62 | 2.1%(+0.378)#5,170 |
| 63. | Vestavia Hills | 2.4% | 1.3%(+1.16)#63 | 2.1%(+0.360)#5,230 |
| 64. | Highland Lake | 2.4% | 1.3%(+1.15)#64 | 2.1%(+0.349)#5,272 |
| 65. | Meadowbrook | 2.4% | 1.3%(+1.13)#65 | 2.1%(+0.329)#5,327 |
| 66. | Kimberly | 2.4% | 1.3%(+1.13)#66 | 2.1%(+0.329)#5,328 |
| 67. | Abbeville | 2.4% | 1.3%(+1.13)#67 | 2.1%(+0.323)#5,346 |
| 68. | Jackson | 2.4% | 1.3%(+1.12)#68 | 2.1%(+0.320)#5,356 |
| 69. | Hoover | 2.3% | 1.3%(+1.09)#69 | 2.1%(+0.288)#5,454 |
| 70. | Moores Mill | 2.3% | 1.3%(+1.07)#70 | 2.1%(+0.270)#5,525 |
| 71. | Troy | 2.3% | 1.3%(+1.07)#71 | 2.1%(+0.268)#5,532 |
| 72. | Centreville | 2.3% | 1.3%(+1.05)#72 | 2.1%(+0.247)#5,601 |
| 73. | Stevenson | 2.3% | 1.3%(+1.04)#73 | 2.1%(+0.239)#5,620 |
| 74. | Gilbertown | 2.3% | 1.3%(+0.996)#74 | 2.1%(+0.193)#5,796 |
| 75. | Brilliant | 2.2% | 1.3%(+0.959)#75 | 2.1%(+0.155)#5,920 |
| 76. | Pell City | 2.2% | 1.3%(+0.954)#76 | 2.1%(+0.151)#5,941 |
| 77. | St Florian | 2.2% | 1.3%(+0.908)#77 | 2.1%(+0.105)#6,101 |
| 78. | Owens Cross Roads | 2.2% | 1.3%(+0.900)#78 | 2.1%(+0.097)#6,125 |
| 79. | Priceville | 2.2% | 1.3%(+0.895)#79 | 2.1%(+0.092)#6,139 |
| 80. | Langston | 2.2% | 1.3%(+0.893)#80 | 2.1%(+0.090)#6,155 |
| 81. | Coffee Springs | 2.2% | 1.3%(+0.893)#81 | 2.1%(+0.090)#6,158 |
| 82. | Whitesboro | 2.1% | 1.3%(+0.883)#82 | 2.1%(+0.080)#6,185 |
| 83. | Tuscaloosa | 2.1% | 1.3%(+0.880)#83 | 2.1%(+0.077)#6,197 |
| 84. | Cottondale | 2.1% | 1.3%(+0.861)#84 | 2.1%(+0.058)#6,266 |
| 85. | Auburn | 2.1% | 1.3%(+0.817)#85 | 2.1%(+0.014)#6,446 |
| 86. | Columbiana | 2.1% | 1.3%(+0.801)#86 | 2.1%(-0.002)#6,512 |
| 87. | Millbrook | 2.0% | 1.3%(+0.790)#87 | 2.1%(-0.013)#6,559 |
| 88. | Spanish Fort | 2.0% | 1.3%(+0.737)#88 | 2.1%(-0.066)#6,768 |
| 89. | Graysville | 2.0% | 1.3%(+0.736)#89 | 2.1%(-0.067)#6,775 |
| 90. | Irondale | 2.0% | 1.3%(+0.720)#90 | 2.1%(-0.083)#6,836 |
| 91. | Chickasaw | 1.9% | 1.3%(+0.687)#91 | 2.1%(-0.117)#6,961 |
| 92. | Hazel Green | 1.9% | 1.3%(+0.664)#92 | 2.1%(-0.139)#7,058 |
| 93. | Huntsville | 1.9% | 1.3%(+0.634)#93 | 2.1%(-0.170)#7,172 |
| 94. | Sumiton | 1.9% | 1.3%(+0.628)#94 | 2.1%(-0.176)#7,214 |
| 95. | Madison | 1.9% | 1.3%(+0.618)#95 | 2.1%(-0.185)#7,246 |
| 96. | County Line | 1.9% | 1.3%(+0.606)#96 | 2.1%(-0.198)#7,300 |
| 97. | Westover | 1.8% | 1.3%(+0.576)#97 | 2.1%(-0.227)#7,457 |
| 98. | Babbie | 1.8% | 1.3%(+0.574)#98 | 2.1%(-0.229)#7,465 |
| 99. | Newton | 1.8% | 1.3%(+0.567)#99 | 2.1%(-0.236)#7,499 |
| 100. | Madrid | 1.8% | 1.3%(+0.561)#100 | 2.1%(-0.243)#7,541 |
Common Questions
What are the Top 10 Cities with the Highest Percentage of Population Employed in Arts, Media & Entertainment in Alabama?
Top 10 Cities with the Highest Percentage of Population Employed in Arts, Media & Entertainment in Alabama are:
#1
31.5%
#2
30.4%
#3
9.9%
#4
9.9%
#5
9.8%
#6
8.2%
#7
7.2%
#8
7.1%
#9
7.1%
#10
6.9%
What city has the Highest Percentage of Population Employed in Arts, Media & Entertainment in Alabama?
East Point has the Highest Percentage of Population Employed in Arts, Media & Entertainment in Alabama with 31.5%.
What is the Percentage of Population Employed in Arts, Media & Entertainment in the State of Alabama?
Percentage of Population Employed in Arts, Media & Entertainment in Alabama is 1.3%.
What is the Percentage of Population Employed in Arts, Media & Entertainment in the United States?
Percentage of Population Employed in Arts, Media & Entertainment in the United States is 2.1%.