Cities with the Highest Percentage of Cuban Population in New York
RELATED REPORTS & OPTIONS
Cuban
New York
Compare Cities
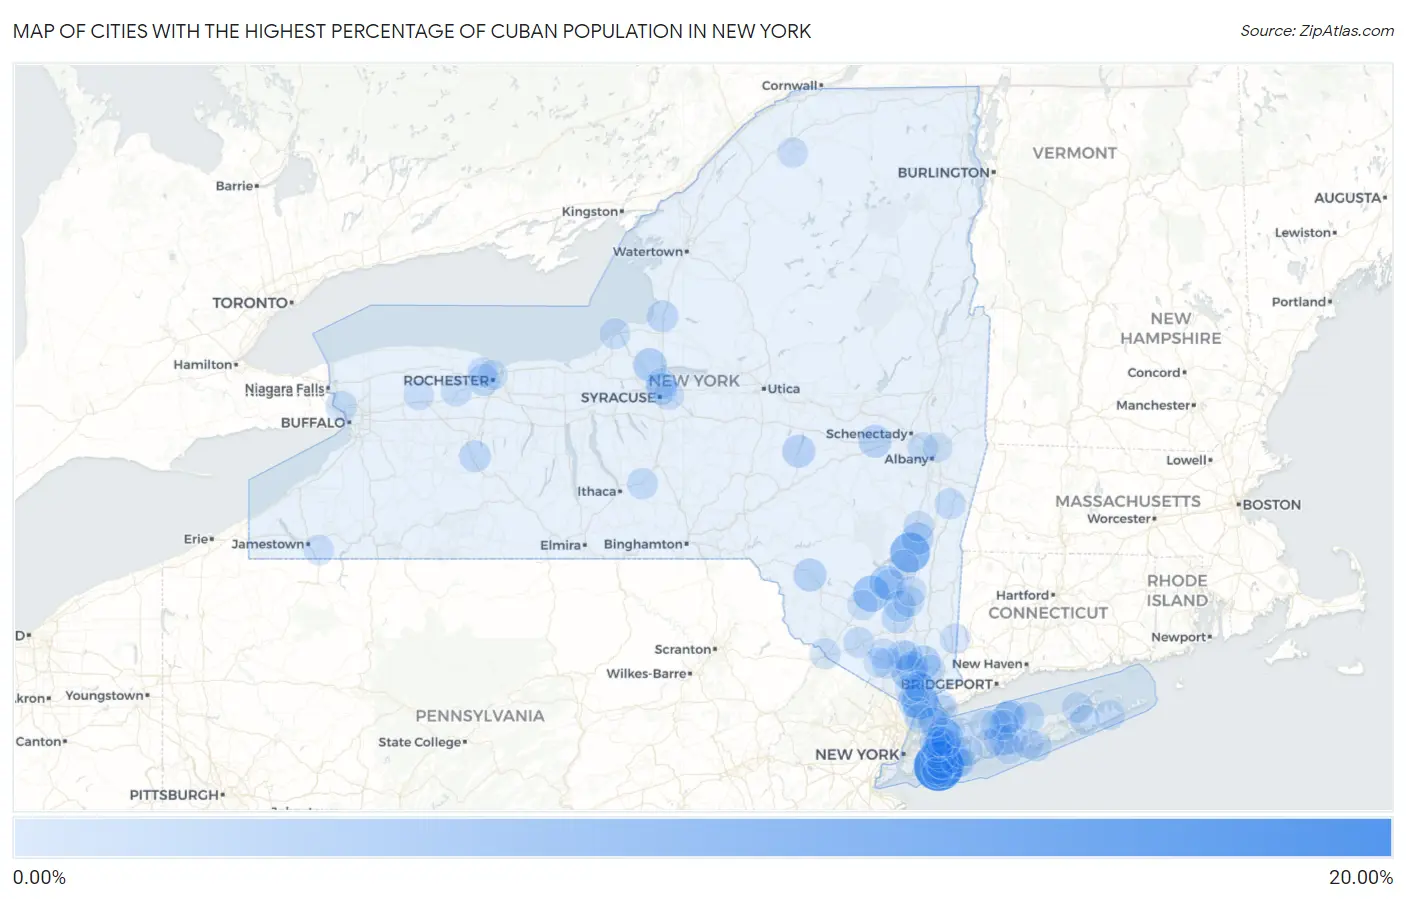
Map of Cities with the Highest Percentage of Cuban Population in New York
0.00%
20.00%
Cities with the Highest Percentage of Cuban Population in New York
| City | Cuban | vs State | vs National | |
| 1. | Hewlett Bay Park | 17.85% | 0.40%(+17.4)#1 | 0.73%(+17.1)#83 |
| 2. | Glasco | 9.14% | 0.40%(+8.73)#2 | 0.73%(+8.41)#141 |
| 3. | Swan Lake | 8.03% | 0.40%(+7.63)#3 | 0.73%(+7.31)#165 |
| 4. | Tarrytown | 6.26% | 0.40%(+5.86)#4 | 0.73%(+5.53)#213 |
| 5. | Kerhonkson | 6.08% | 0.40%(+5.68)#5 | 0.73%(+5.36)#218 |
| 6. | Glenwood Landing | 5.68% | 0.40%(+5.28)#6 | 0.73%(+4.96)#229 |
| 7. | Verplanck | 4.77% | 0.40%(+4.37)#7 | 0.73%(+4.05)#275 |
| 8. | Millwood | 4.60% | 0.40%(+4.19)#8 | 0.73%(+3.87)#286 |
| 9. | Barnum Island | 4.12% | 0.40%(+3.72)#9 | 0.73%(+3.40)#318 |
| 10. | Shrub Oak | 4.06% | 0.40%(+3.66)#10 | 0.73%(+3.34)#326 |
| 11. | Stone Ridge | 4.00% | 0.40%(+3.60)#11 | 0.73%(+3.27)#332 |
| 12. | Woodsburgh | 3.95% | 0.40%(+3.54)#12 | 0.73%(+3.22)#338 |
| 13. | Sand Ridge | 3.87% | 0.40%(+3.47)#13 | 0.73%(+3.14)#350 |
| 14. | Livingston Manor | 3.36% | 0.40%(+2.96)#14 | 0.73%(+2.63)#405 |
| 15. | Esperance | 3.25% | 0.40%(+2.85)#15 | 0.73%(+2.52)#419 |
| 16. | Cooperstown | 3.24% | 0.40%(+2.84)#16 | 0.73%(+2.52)#420 |
| 17. | Belle Terre | 2.84% | 0.40%(+2.43)#17 | 0.73%(+2.11)#480 |
| 18. | Grand View On Hudson | 2.83% | 0.40%(+2.43)#18 | 0.73%(+2.10)#482 |
| 19. | Peekskill | 2.72% | 0.40%(+2.31)#19 | 0.73%(+1.99)#504 |
| 20. | Germantown | 2.72% | 0.40%(+2.31)#20 | 0.73%(+1.99)#505 |
| 21. | High Falls | 2.49% | 0.40%(+2.09)#21 | 0.73%(+1.76)#562 |
| 22. | Gates | 2.42% | 0.40%(+2.01)#22 | 0.73%(+1.69)#586 |
| 23. | Plattekill | 2.41% | 0.40%(+2.01)#23 | 0.73%(+1.68)#587 |
| 24. | Pulaski | 2.39% | 0.40%(+1.99)#24 | 0.73%(+1.67)#599 |
| 25. | Mattydale | 2.37% | 0.40%(+1.97)#25 | 0.73%(+1.64)#606 |
| 26. | Lynbrook | 2.34% | 0.40%(+1.93)#26 | 0.73%(+1.61)#615 |
| 27. | Manhasset | 2.29% | 0.40%(+1.89)#27 | 0.73%(+1.57)#634 |
| 28. | North New Hyde Park | 2.28% | 0.40%(+1.88)#28 | 0.73%(+1.55)#640 |
| 29. | Poquott | 2.26% | 0.40%(+1.85)#29 | 0.73%(+1.53)#649 |
| 30. | Groveland Station | 2.18% | 0.40%(+1.78)#30 | 0.73%(+1.45)#686 |
| 31. | Sea Cliff | 2.11% | 0.40%(+1.71)#31 | 0.73%(+1.39)#707 |
| 32. | Clintondale | 2.01% | 0.40%(+1.61)#32 | 0.73%(+1.28)#743 |
| 33. | Bellerose | 1.90% | 0.40%(+1.50)#33 | 0.73%(+1.18)#792 |
| 34. | Shoreham | 1.86% | 0.40%(+1.46)#34 | 0.73%(+1.13)#808 |
| 35. | Highland | 1.83% | 0.40%(+1.43)#35 | 0.73%(+1.11)#824 |
| 36. | Dryden | 1.80% | 0.40%(+1.39)#36 | 0.73%(+1.07)#842 |
| 37. | Briarcliff Manor | 1.78% | 0.40%(+1.38)#37 | 0.73%(+1.06)#852 |
| 38. | Grandyle Village | 1.72% | 0.40%(+1.32)#38 | 0.73%(+0.995)#890 |
| 39. | Great Neck Plaza | 1.68% | 0.40%(+1.28)#39 | 0.73%(+0.953)#921 |
| 40. | Chatham | 1.64% | 0.40%(+1.24)#40 | 0.73%(+0.919)#939 |
| 41. | Wantagh | 1.64% | 0.40%(+1.24)#41 | 0.73%(+0.919)#940 |
| 42. | Nissequogue | 1.64% | 0.40%(+1.24)#42 | 0.73%(+0.915)#942 |
| 43. | North Syracuse | 1.63% | 0.40%(+1.23)#43 | 0.73%(+0.908)#946 |
| 44. | Mechanicstown | 1.61% | 0.40%(+1.21)#44 | 0.73%(+0.886)#960 |
| 45. | Port Jervis | 1.57% | 0.40%(+1.17)#45 | 0.73%(+0.844)#986 |
| 46. | North Merrick | 1.55% | 0.40%(+1.15)#46 | 0.73%(+0.824)#1,004 |
| 47. | East Rockaway | 1.50% | 0.40%(+1.10)#47 | 0.73%(+0.773)#1,026 |
| 48. | Yorktown Heights | 1.49% | 0.40%(+1.09)#48 | 0.73%(+0.764)#1,034 |
| 49. | Cutchogue | 1.47% | 0.40%(+1.07)#49 | 0.73%(+0.742)#1,047 |
| 50. | Catskill | 1.46% | 0.40%(+1.06)#50 | 0.73%(+0.736)#1,051 |
| 51. | Bergen | 1.42% | 0.40%(+1.02)#51 | 0.73%(+0.696)#1,083 |
| 52. | Mastic Beach | 1.42% | 0.40%(+1.02)#52 | 0.73%(+0.694)#1,085 |
| 53. | Mamaroneck | 1.39% | 0.40%(+0.986)#53 | 0.73%(+0.663)#1,100 |
| 54. | Rye Brook | 1.35% | 0.40%(+0.947)#54 | 0.73%(+0.624)#1,127 |
| 55. | Suny Oswego | 1.35% | 0.40%(+0.945)#55 | 0.73%(+0.622)#1,130 |
| 56. | Islandia | 1.35% | 0.40%(+0.942)#56 | 0.73%(+0.619)#1,135 |
| 57. | Ronkonkoma | 1.33% | 0.40%(+0.924)#57 | 0.73%(+0.601)#1,147 |
| 58. | Harriman | 1.32% | 0.40%(+0.916)#58 | 0.73%(+0.593)#1,153 |
| 59. | Colonie | 1.31% | 0.40%(+0.910)#59 | 0.73%(+0.587)#1,159 |
| 60. | Lincoln Park | 1.31% | 0.40%(+0.902)#60 | 0.73%(+0.579)#1,165 |
| 61. | Highland Falls | 1.29% | 0.40%(+0.887)#61 | 0.73%(+0.564)#1,176 |
| 62. | Holtsville | 1.27% | 0.40%(+0.867)#62 | 0.73%(+0.544)#1,190 |
| 63. | West Point | 1.27% | 0.40%(+0.865)#63 | 0.73%(+0.542)#1,193 |
| 64. | Ellenville | 1.23% | 0.40%(+0.831)#64 | 0.73%(+0.508)#1,228 |
| 65. | Hannawa Falls | 1.23% | 0.40%(+0.830)#65 | 0.73%(+0.507)#1,229 |
| 66. | East Syracuse | 1.21% | 0.40%(+0.804)#66 | 0.73%(+0.481)#1,247 |
| 67. | Franklin Square | 1.19% | 0.40%(+0.791)#67 | 0.73%(+0.469)#1,259 |
| 68. | Sayville | 1.19% | 0.40%(+0.786)#68 | 0.73%(+0.463)#1,266 |
| 69. | Oakfield | 1.19% | 0.40%(+0.785)#69 | 0.73%(+0.462)#1,267 |
| 70. | Brentwood | 1.17% | 0.40%(+0.770)#70 | 0.73%(+0.447)#1,283 |
| 71. | South Blooming Grove | 1.17% | 0.40%(+0.763)#71 | 0.73%(+0.440)#1,289 |
| 72. | Frewsburg | 1.16% | 0.40%(+0.760)#72 | 0.73%(+0.437)#1,292 |
| 73. | Roslyn Heights | 1.16% | 0.40%(+0.753)#73 | 0.73%(+0.431)#1,298 |
| 74. | Bellmore | 1.13% | 0.40%(+0.726)#74 | 0.73%(+0.403)#1,324 |
| 75. | Stony Brook | 1.12% | 0.40%(+0.716)#75 | 0.73%(+0.394)#1,338 |
| 76. | Milton Cdp Ulster County | 1.09% | 0.40%(+0.686)#76 | 0.73%(+0.364)#1,369 |
| 77. | East Atlantic Beach | 1.08% | 0.40%(+0.672)#77 | 0.73%(+0.349)#1,386 |
| 78. | Hyde Park | 1.07% | 0.40%(+0.666)#78 | 0.73%(+0.343)#1,393 |
| 79. | East Hampton North | 1.06% | 0.40%(+0.653)#79 | 0.73%(+0.330)#1,404 |
| 80. | Greece | 1.06% | 0.40%(+0.652)#80 | 0.73%(+0.329)#1,406 |
| 81. | Port Chester | 1.03% | 0.40%(+0.626)#81 | 0.73%(+0.303)#1,433 |
| 82. | Levittown | 1.03% | 0.40%(+0.622)#82 | 0.73%(+0.299)#1,440 |
| 83. | Putnam Lake | 1.02% | 0.40%(+0.616)#83 | 0.73%(+0.293)#1,448 |
| 84. | Springwater | 1.02% | 0.40%(+0.612)#84 | 0.73%(+0.289)#1,453 |
| 85. | Congers | 1.00% | 0.40%(+0.599)#85 | 0.73%(+0.276)#1,467 |
| 86. | Farmingdale | 1.00% | 0.40%(+0.593)#86 | 0.73%(+0.270)#1,477 |
| 87. | Hastings On Hudson | 0.99% | 0.40%(+0.590)#87 | 0.73%(+0.267)#1,486 |
| 88. | Lake Success | 0.99% | 0.40%(+0.588)#88 | 0.73%(+0.265)#1,491 |
| 89. | Rochester | 0.98% | 0.40%(+0.577)#89 | 0.73%(+0.254)#1,504 |
| 90. | Yonkers | 0.98% | 0.40%(+0.573)#90 | 0.73%(+0.250)#1,514 |
| 91. | Munsey Park | 0.97% | 0.40%(+0.564)#91 | 0.73%(+0.241)#1,528 |
| 92. | Watervliet | 0.94% | 0.40%(+0.536)#92 | 0.73%(+0.213)#1,571 |
| 93. | Brookhaven | 0.94% | 0.40%(+0.536)#93 | 0.73%(+0.213)#1,573 |
| 94. | Fort Salonga | 0.94% | 0.40%(+0.532)#94 | 0.73%(+0.209)#1,581 |
| 95. | East Hills | 0.93% | 0.40%(+0.522)#95 | 0.73%(+0.199)#1,596 |
| 96. | Ossining | 0.92% | 0.40%(+0.520)#96 | 0.73%(+0.197)#1,601 |
| 97. | Walton Park | 0.89% | 0.40%(+0.490)#97 | 0.73%(+0.168)#1,649 |
| 98. | North Sea | 0.88% | 0.40%(+0.472)#98 | 0.73%(+0.149)#1,672 |
| 99. | Oyster Bay Cove | 0.88% | 0.40%(+0.472)#99 | 0.73%(+0.149)#1,673 |
| 100. | Larchmont | 0.87% | 0.40%(+0.467)#100 | 0.73%(+0.144)#1,685 |
Common Questions
What are the Top 10 Cities with the Highest Percentage of Cuban Population in New York?
Top 10 Cities with the Highest Percentage of Cuban Population in New York are:
#1
17.85%
#2
9.14%
#3
6.26%
#4
6.08%
#5
5.68%
#6
4.77%
#7
4.12%
#8
4.06%
#9
4.00%
#10
3.95%
What city has the Highest Percentage of Cuban Population in New York?
Hewlett Bay Park has the Highest Percentage of Cuban Population in New York with 17.85%.
What is the Percentage of Cuban Population in the State of New York?
Percentage of Cuban Population in New York is 0.40%.
What is the Percentage of Cuban Population in the United States?
Percentage of Cuban Population in the United States is 0.73%.