Cities with the Highest Percentage of Cuban Population in Kentucky
RELATED REPORTS & OPTIONS
Cuban
Kentucky
Compare Cities
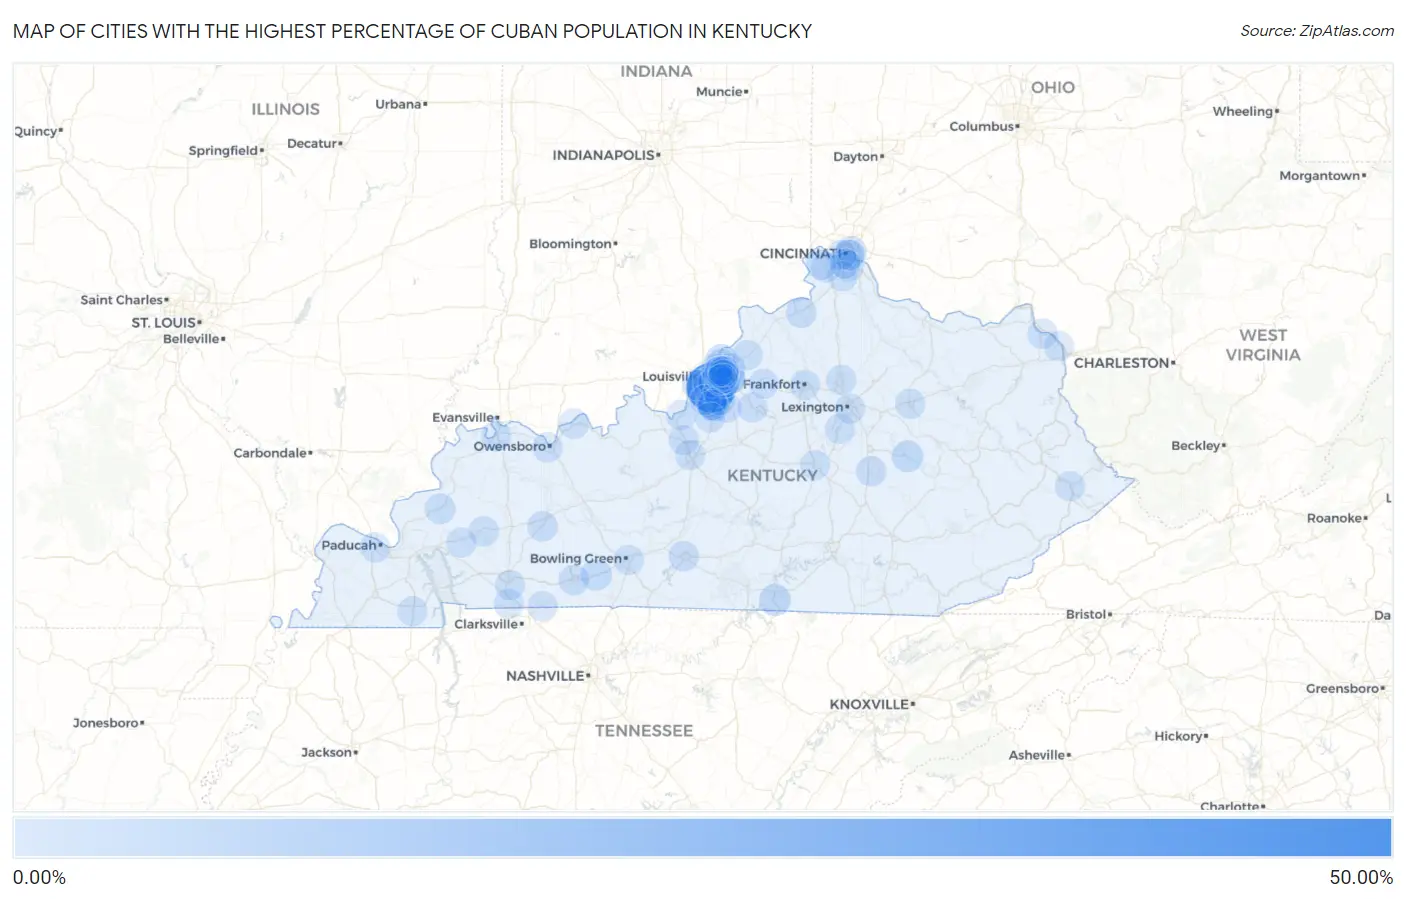
Map of Cities with the Highest Percentage of Cuban Population in Kentucky
0.00%
50.00%
Cities with the Highest Percentage of Cuban Population in Kentucky
| City | Cuban | vs State | vs National | |
| 1. | Poplar Hills | 49.52% | 0.48%(+49.0)#1 | 0.73%(+48.8)#21 |
| 2. | West Buechel | 6.15% | 0.48%(+5.67)#2 | 0.73%(+5.42)#217 |
| 3. | Hillview | 4.85% | 0.48%(+4.37)#3 | 0.73%(+4.12)#271 |
| 4. | Albany | 4.15% | 0.48%(+3.67)#4 | 0.73%(+3.43)#317 |
| 5. | River Bluff | 3.63% | 0.48%(+3.15)#5 | 0.73%(+2.90)#370 |
| 6. | Irvine | 3.52% | 0.48%(+3.04)#6 | 0.73%(+2.79)#380 |
| 7. | Strathmoor Village | 3.43% | 0.48%(+2.95)#7 | 0.73%(+2.70)#393 |
| 8. | Auburn | 2.92% | 0.48%(+2.44)#8 | 0.73%(+2.19)#460 |
| 9. | Woodland Hills | 2.90% | 0.48%(+2.42)#9 | 0.73%(+2.17)#466 |
| 10. | Louisville | 2.47% | 0.48%(+1.99)#10 | 0.73%(+1.74)#571 |
| 11. | Spring Mill | 2.46% | 0.48%(+1.98)#11 | 0.73%(+1.74)#572 |
| 12. | Worthington Hills | 2.15% | 0.48%(+1.67)#12 | 0.73%(+1.43)#694 |
| 13. | Bellemeade | 1.80% | 0.48%(+1.32)#13 | 0.73%(+1.07)#839 |
| 14. | Blue Ridge Manor | 1.76% | 0.48%(+1.28)#14 | 0.73%(+1.03)#871 |
| 15. | Sparta | 1.42% | 0.48%(+0.942)#15 | 0.73%(+0.697)#1,081 |
| 16. | Marion | 1.34% | 0.48%(+0.861)#16 | 0.73%(+0.616)#1,138 |
| 17. | Hebron Estates | 1.30% | 0.48%(+0.818)#17 | 0.73%(+0.573)#1,169 |
| 18. | Lynnview | 1.25% | 0.48%(+0.767)#18 | 0.73%(+0.522)#1,214 |
| 19. | Woodlawn | 1.12% | 0.48%(+0.636)#19 | 0.73%(+0.391)#1,340 |
| 20. | Graymoor Devondale | 1.09% | 0.48%(+0.608)#20 | 0.73%(+0.363)#1,372 |
| 21. | Russellville | 1.09% | 0.48%(+0.604)#21 | 0.73%(+0.359)#1,377 |
| 22. | Shively | 1.02% | 0.48%(+0.538)#22 | 0.73%(+0.293)#1,447 |
| 23. | Westwood | 1.01% | 0.48%(+0.527)#23 | 0.73%(+0.282)#1,461 |
| 24. | Mount Washington | 0.98% | 0.48%(+0.497)#24 | 0.73%(+0.252)#1,512 |
| 25. | Wellington | 0.90% | 0.48%(+0.422)#25 | 0.73%(+0.177)#1,631 |
| 26. | Dayton | 0.90% | 0.48%(+0.417)#26 | 0.73%(+0.172)#1,637 |
| 27. | Hollow Creek | 0.85% | 0.48%(+0.373)#27 | 0.73%(+0.128)#1,715 |
| 28. | Greenville | 0.85% | 0.48%(+0.370)#28 | 0.73%(+0.125)#1,719 |
| 29. | Moorland | 0.78% | 0.48%(+0.303)#29 | 0.73%(+0.058)#1,830 |
| 30. | Jeffersontown | 0.75% | 0.48%(+0.269)#30 | 0.73%(+0.024)#1,894 |
| 31. | Glasgow | 0.74% | 0.48%(+0.263)#31 | 0.73%(+0.018)#1,903 |
| 32. | Berea | 0.73% | 0.48%(+0.246)#32 | 0.73%(+0.001)#1,942 |
| 33. | Glenview | 0.70% | 0.48%(+0.215)#33 | 0.73%(-0.030)#2,008 |
| 34. | Forest Hills | 0.68% | 0.48%(+0.200)#34 | 0.73%(-0.045)#2,038 |
| 35. | Henderson | 0.64% | 0.48%(+0.161)#35 | 0.73%(-0.084)#2,146 |
| 36. | Hunters Hollow | 0.61% | 0.48%(+0.130)#36 | 0.73%(-0.115)#2,214 |
| 37. | St Matthews | 0.58% | 0.48%(+0.101)#37 | 0.73%(-0.144)#2,313 |
| 38. | Taylor Mill | 0.57% | 0.48%(+0.088)#38 | 0.73%(-0.157)#2,367 |
| 39. | Newport | 0.56% | 0.48%(+0.075)#39 | 0.73%(-0.170)#2,413 |
| 40. | Hollyvilla | 0.53% | 0.48%(+0.051)#40 | 0.73%(-0.194)#2,507 |
| 41. | West Point | 0.47% | 0.48%(-0.015)#41 | 0.73%(-0.260)#2,757 |
| 42. | Elizabethtown | 0.46% | 0.48%(-0.020)#42 | 0.73%(-0.265)#2,779 |
| 43. | Middletown | 0.46% | 0.48%(-0.023)#43 | 0.73%(-0.268)#2,786 |
| 44. | Heritage Creek | 0.45% | 0.48%(-0.031)#44 | 0.73%(-0.276)#2,814 |
| 45. | Independence | 0.45% | 0.48%(-0.036)#45 | 0.73%(-0.281)#2,838 |
| 46. | Langdon Place | 0.43% | 0.48%(-0.053)#46 | 0.73%(-0.298)#2,917 |
| 47. | Georgetown | 0.40% | 0.48%(-0.081)#47 | 0.73%(-0.327)#3,047 |
| 48. | Prospect | 0.39% | 0.48%(-0.092)#48 | 0.73%(-0.337)#3,098 |
| 49. | Lewisport | 0.37% | 0.48%(-0.114)#49 | 0.73%(-0.359)#3,219 |
| 50. | Guthrie | 0.35% | 0.48%(-0.128)#50 | 0.73%(-0.373)#3,286 |
| 51. | Taylorsville | 0.35% | 0.48%(-0.132)#51 | 0.73%(-0.377)#3,309 |
| 52. | Murray Hill | 0.34% | 0.48%(-0.139)#52 | 0.73%(-0.385)#3,357 |
| 53. | Ludlow | 0.32% | 0.48%(-0.162)#53 | 0.73%(-0.407)#3,514 |
| 54. | Mount Sterling | 0.31% | 0.48%(-0.176)#54 | 0.73%(-0.421)#3,609 |
| 55. | Shepherdsville | 0.30% | 0.48%(-0.177)#55 | 0.73%(-0.422)#3,615 |
| 56. | Radcliff | 0.30% | 0.48%(-0.181)#56 | 0.73%(-0.426)#3,644 |
| 57. | St Regis Park | 0.30% | 0.48%(-0.182)#57 | 0.73%(-0.427)#3,654 |
| 58. | Danville | 0.28% | 0.48%(-0.202)#58 | 0.73%(-0.447)#3,811 |
| 59. | Northfield | 0.27% | 0.48%(-0.210)#59 | 0.73%(-0.455)#3,858 |
| 60. | Bowling Green | 0.27% | 0.48%(-0.211)#60 | 0.73%(-0.456)#3,863 |
| 61. | Old Brownsboro Place | 0.26% | 0.48%(-0.221)#61 | 0.73%(-0.466)#3,938 |
| 62. | Shelbyville | 0.26% | 0.48%(-0.226)#62 | 0.73%(-0.471)#3,975 |
| 63. | Nicholasville | 0.22% | 0.48%(-0.258)#63 | 0.73%(-0.503)#4,213 |
| 64. | Lyndon | 0.22% | 0.48%(-0.263)#64 | 0.73%(-0.508)#4,257 |
| 65. | Dawson Springs | 0.20% | 0.48%(-0.284)#65 | 0.73%(-0.529)#4,426 |
| 66. | Lexington | 0.20% | 0.48%(-0.286)#66 | 0.73%(-0.531)#4,436 |
| 67. | Oakbrook | 0.18% | 0.48%(-0.302)#67 | 0.73%(-0.547)#4,590 |
| 68. | Covington | 0.18% | 0.48%(-0.303)#68 | 0.73%(-0.548)#4,598 |
| 69. | Wurtland | 0.18% | 0.48%(-0.305)#69 | 0.73%(-0.550)#4,612 |
| 70. | Pikeville | 0.17% | 0.48%(-0.309)#70 | 0.73%(-0.555)#4,656 |
| 71. | La Grange | 0.17% | 0.48%(-0.313)#71 | 0.73%(-0.558)#4,688 |
| 72. | Princeton | 0.16% | 0.48%(-0.321)#72 | 0.73%(-0.566)#4,776 |
| 73. | Pioneer Village | 0.15% | 0.48%(-0.333)#73 | 0.73%(-0.578)#4,895 |
| 74. | Burlington | 0.14% | 0.48%(-0.339)#74 | 0.73%(-0.584)#4,954 |
| 75. | Murray | 0.11% | 0.48%(-0.367)#75 | 0.73%(-0.612)#5,227 |
| 76. | Paducah | 0.11% | 0.48%(-0.370)#76 | 0.73%(-0.615)#5,269 |
| 77. | Owensboro | 0.072% | 0.48%(-0.410)#77 | 0.73%(-0.655)#5,707 |
| 78. | Ashland | 0.070% | 0.48%(-0.412)#78 | 0.73%(-0.657)#5,735 |
| 79. | Fort Campbell North | 0.067% | 0.48%(-0.415)#79 | 0.73%(-0.660)#5,770 |
| 80. | Hurstbourne | 0.064% | 0.48%(-0.417)#80 | 0.73%(-0.662)#5,792 |
| 81. | Frankfort | 0.060% | 0.48%(-0.422)#81 | 0.73%(-0.667)#5,850 |
| 82. | Hopkinsville | 0.058% | 0.48%(-0.423)#82 | 0.73%(-0.668)#5,863 |
Common Questions
What are the Top 10 Cities with the Highest Percentage of Cuban Population in Kentucky?
Top 10 Cities with the Highest Percentage of Cuban Population in Kentucky are:
#1
49.52%
#2
6.15%
#3
4.85%
#4
4.15%
#5
3.63%
#6
3.52%
#7
3.43%
#8
2.92%
#9
2.90%
#10
2.47%
What city has the Highest Percentage of Cuban Population in Kentucky?
Poplar Hills has the Highest Percentage of Cuban Population in Kentucky with 49.52%.
What is the Percentage of Cuban Population in the State of Kentucky?
Percentage of Cuban Population in Kentucky is 0.48%.
What is the Percentage of Cuban Population in the United States?
Percentage of Cuban Population in the United States is 0.73%.