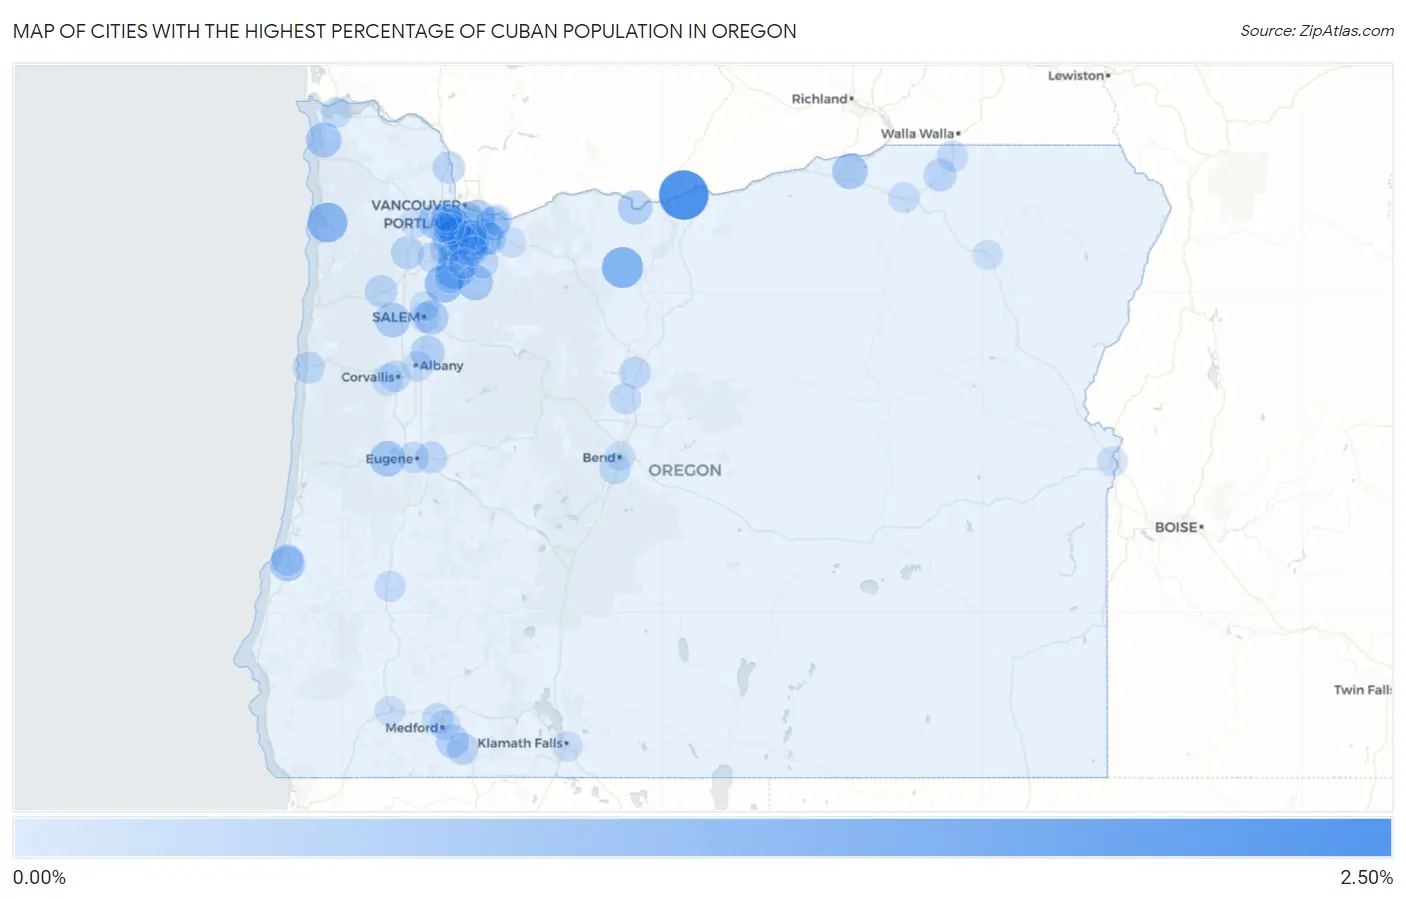
Cities with the Highest Percentage of Cuban Population in Oregon
RELATED REPORTS & OPTIONS
Cuban
Oregon
Compare Cities
Map of Cities with the Highest Percentage of Cuban Population in Oregon
0.00%
2.50%
Cities with the Highest Percentage of Cuban Population in Oregon
| City | Cuban | vs State | vs National | |
| 1. | Rufus | 2.27% | 0.19%(+2.09)#1 | 0.73%(+1.55)#641 |
| 2. | San Marine | 1.33% | 0.19%(+1.14)#2 | 0.73%(+0.599)#1,149 |
| 3. | Pine Hollow | 1.25% | 0.19%(+1.06)#3 | 0.73%(+0.521)#1,217 |
| 4. | Bay City | 1.12% | 0.19%(+0.939)#4 | 0.73%(+0.398)#1,332 |
| 5. | Aurora | 0.95% | 0.19%(+0.763)#5 | 0.73%(+0.221)#1,561 |
| 6. | Woodburn | 0.89% | 0.19%(+0.703)#6 | 0.73%(+0.162)#1,659 |
| 7. | West Linn | 0.72% | 0.19%(+0.536)#7 | 0.73%(-0.005)#1,952 |
| 8. | Happy Valley | 0.71% | 0.19%(+0.529)#8 | 0.73%(-0.013)#1,969 |
| 9. | West Slope | 0.65% | 0.19%(+0.460)#9 | 0.73%(-0.081)#2,131 |
| 10. | Veneta | 0.64% | 0.19%(+0.452)#10 | 0.73%(-0.089)#2,159 |
| 11. | Molalla | 0.63% | 0.19%(+0.446)#11 | 0.73%(-0.096)#2,175 |
| 12. | Hermiston | 0.62% | 0.19%(+0.433)#12 | 0.73%(-0.109)#2,195 |
| 13. | Gearhart | 0.58% | 0.19%(+0.397)#13 | 0.73%(-0.144)#2,312 |
| 14. | Santa Clara | 0.58% | 0.19%(+0.395)#14 | 0.73%(-0.146)#2,319 |
| 15. | Coos Bay | 0.58% | 0.19%(+0.392)#15 | 0.73%(-0.150)#2,334 |
| 16. | Maywood Park | 0.58% | 0.19%(+0.390)#16 | 0.73%(-0.151)#2,342 |
| 17. | Dallas | 0.54% | 0.19%(+0.352)#17 | 0.73%(-0.189)#2,484 |
| 18. | Hillsboro | 0.53% | 0.19%(+0.346)#18 | 0.73%(-0.195)#2,511 |
| 19. | Tigard | 0.51% | 0.19%(+0.326)#19 | 0.73%(-0.215)#2,581 |
| 20. | Four Corners | 0.49% | 0.19%(+0.310)#20 | 0.73%(-0.231)#2,640 |
| 21. | Jennings Lodge | 0.48% | 0.19%(+0.298)#21 | 0.73%(-0.243)#2,684 |
| 22. | The Dalles | 0.46% | 0.19%(+0.278)#22 | 0.73%(-0.264)#2,772 |
| 23. | Jefferson | 0.45% | 0.19%(+0.266)#23 | 0.73%(-0.275)#2,813 |
| 24. | Gresham | 0.42% | 0.19%(+0.237)#24 | 0.73%(-0.304)#2,950 |
| 25. | Portland | 0.39% | 0.19%(+0.205)#25 | 0.73%(-0.336)#3,096 |
| 26. | Talent | 0.35% | 0.19%(+0.167)#26 | 0.73%(-0.375)#3,297 |
| 27. | Yamhill | 0.34% | 0.19%(+0.153)#27 | 0.73%(-0.389)#3,384 |
| 28. | Metzger | 0.31% | 0.19%(+0.120)#28 | 0.73%(-0.421)#3,610 |
| 29. | Athena | 0.30% | 0.19%(+0.115)#29 | 0.73%(-0.426)#3,645 |
| 30. | Sheridan | 0.29% | 0.19%(+0.103)#30 | 0.73%(-0.438)#3,729 |
| 31. | Tualatin | 0.29% | 0.19%(+0.103)#31 | 0.73%(-0.439)#3,740 |
| 32. | Garden Home Whitford | 0.28% | 0.19%(+0.097)#32 | 0.73%(-0.444)#3,782 |
| 33. | St Helens | 0.26% | 0.19%(+0.079)#33 | 0.73%(-0.462)#3,911 |
| 34. | Sherwood | 0.26% | 0.19%(+0.076)#34 | 0.73%(-0.465)#3,929 |
| 35. | Oak Hills | 0.25% | 0.19%(+0.070)#35 | 0.73%(-0.472)#3,978 |
| 36. | Ashland | 0.25% | 0.19%(+0.063)#36 | 0.73%(-0.479)#4,016 |
| 37. | Oatfield | 0.24% | 0.19%(+0.060)#37 | 0.73%(-0.482)#4,038 |
| 38. | Damascus | 0.24% | 0.19%(+0.052)#38 | 0.73%(-0.490)#4,098 |
| 39. | Metolius | 0.22% | 0.19%(+0.032)#39 | 0.73%(-0.509)#4,267 |
| 40. | North Bend | 0.21% | 0.19%(+0.030)#40 | 0.73%(-0.512)#4,289 |
| 41. | Newport | 0.21% | 0.19%(+0.028)#41 | 0.73%(-0.513)#4,299 |
| 42. | Beavercreek | 0.20% | 0.19%(+0.013)#42 | 0.73%(-0.528)#4,420 |
| 43. | Springfield | 0.19% | 0.19%(+0.006)#43 | 0.73%(-0.535)#4,484 |
| 44. | Philomath | 0.18% | 0.19%(-0.001)#44 | 0.73%(-0.542)#4,544 |
| 45. | Wilsonville | 0.18% | 0.19%(-0.008)#45 | 0.73%(-0.549)#4,608 |
| 46. | Cedar Hills | 0.18% | 0.19%(-0.009)#46 | 0.73%(-0.550)#4,613 |
| 47. | Hubbard | 0.18% | 0.19%(-0.010)#47 | 0.73%(-0.551)#4,624 |
| 48. | Troutdale | 0.17% | 0.19%(-0.012)#48 | 0.73%(-0.553)#4,641 |
| 49. | Cedar Mill | 0.17% | 0.19%(-0.013)#49 | 0.73%(-0.554)#4,650 |
| 50. | Eugene | 0.17% | 0.19%(-0.017)#50 | 0.73%(-0.558)#4,693 |
| 51. | Corvallis | 0.17% | 0.19%(-0.017)#51 | 0.73%(-0.558)#4,697 |
| 52. | Deschutes River Woods | 0.16% | 0.19%(-0.024)#52 | 0.73%(-0.566)#4,768 |
| 53. | Central Point | 0.16% | 0.19%(-0.028)#53 | 0.73%(-0.570)#4,808 |
| 54. | Crooked River Ranch | 0.16% | 0.19%(-0.028)#54 | 0.73%(-0.570)#4,811 |
| 55. | Milton Freewater | 0.14% | 0.19%(-0.045)#55 | 0.73%(-0.586)#4,972 |
| 56. | Milwaukie | 0.14% | 0.19%(-0.048)#56 | 0.73%(-0.590)#5,002 |
| 57. | Lake Oswego | 0.13% | 0.19%(-0.057)#57 | 0.73%(-0.598)#5,106 |
| 58. | Roseburg | 0.13% | 0.19%(-0.058)#58 | 0.73%(-0.600)#5,119 |
| 59. | River Road | 0.13% | 0.19%(-0.058)#59 | 0.73%(-0.600)#5,120 |
| 60. | Astoria | 0.12% | 0.19%(-0.067)#60 | 0.73%(-0.609)#5,207 |
| 61. | Beaverton | 0.12% | 0.19%(-0.068)#61 | 0.73%(-0.610)#5,216 |
| 62. | Albany | 0.10% | 0.19%(-0.080)#62 | 0.73%(-0.622)#5,349 |
| 63. | Bethany | 0.097% | 0.19%(-0.088)#63 | 0.73%(-0.630)#5,441 |
| 64. | Newberg | 0.095% | 0.19%(-0.091)#64 | 0.73%(-0.632)#5,464 |
| 65. | Medford | 0.089% | 0.19%(-0.096)#65 | 0.73%(-0.638)#5,519 |
| 66. | Pendleton | 0.088% | 0.19%(-0.097)#66 | 0.73%(-0.638)#5,525 |
| 67. | Canby | 0.072% | 0.19%(-0.113)#67 | 0.73%(-0.655)#5,706 |
| 68. | Ontario | 0.069% | 0.19%(-0.116)#68 | 0.73%(-0.657)#5,740 |
| 69. | Salem | 0.069% | 0.19%(-0.116)#69 | 0.73%(-0.658)#5,741 |
| 70. | Klamath Falls | 0.055% | 0.19%(-0.130)#70 | 0.73%(-0.671)#5,897 |
| 71. | Aloha | 0.054% | 0.19%(-0.131)#71 | 0.73%(-0.672)#5,909 |
| 72. | Keizer | 0.043% | 0.19%(-0.142)#72 | 0.73%(-0.683)#6,007 |
| 73. | Grants Pass | 0.041% | 0.19%(-0.144)#73 | 0.73%(-0.686)#6,034 |
| 74. | Forest Grove | 0.031% | 0.19%(-0.155)#74 | 0.73%(-0.696)#6,122 |
| 75. | La Grande | 0.031% | 0.19%(-0.155)#75 | 0.73%(-0.696)#6,124 |
| 76. | Bend | 0.024% | 0.19%(-0.161)#76 | 0.73%(-0.702)#6,182 |
| 77. | Sandy | 0.024% | 0.19%(-0.161)#77 | 0.73%(-0.703)#6,186 |
| 78. | Oregon City | 0.021% | 0.19%(-0.164)#78 | 0.73%(-0.705)#6,206 |
Common Questions
What are the Top 10 Cities with the Highest Percentage of Cuban Population in Oregon?
Top 10 Cities with the Highest Percentage of Cuban Population in Oregon are:
#1
2.27%
#2
1.25%
#3
1.12%
#4
0.95%
#5
0.89%
#6
0.72%
#7
0.71%
#8
0.65%
#9
0.64%
#10
0.63%
What city has the Highest Percentage of Cuban Population in Oregon?
Rufus has the Highest Percentage of Cuban Population in Oregon with 2.27%.
What is the Percentage of Cuban Population in the State of Oregon?
Percentage of Cuban Population in Oregon is 0.19%.
What is the Percentage of Cuban Population in the United States?
Percentage of Cuban Population in the United States is 0.73%.