Cities with the Highest Percentage of Population with a Degree in Bio, Nature & Agricultural in Illinois
RELATED REPORTS & OPTIONS
Bio, Nature & Agricultural
Illinois
Compare Cities
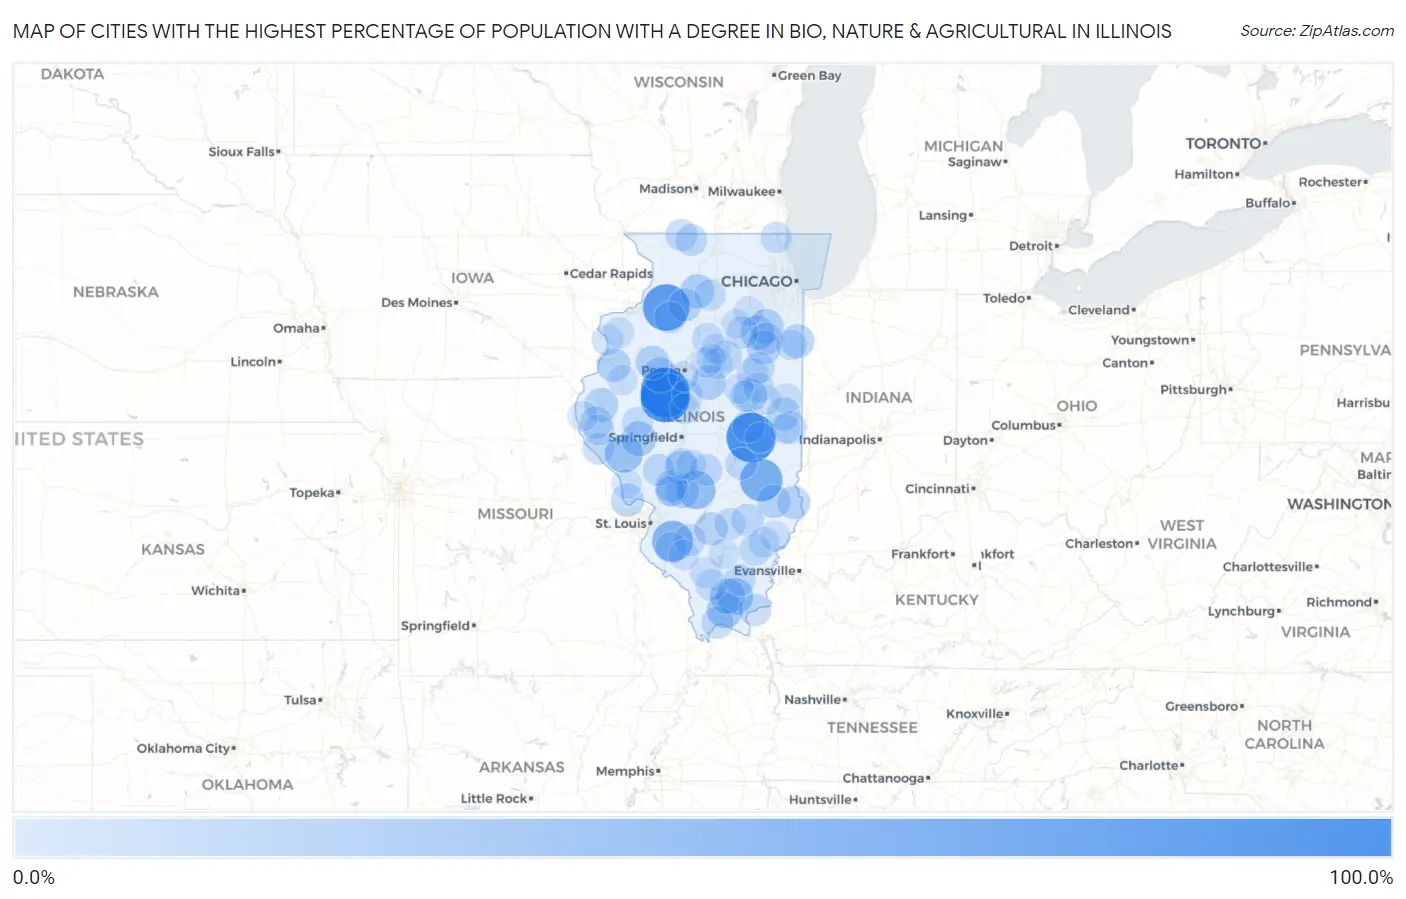
Map of Cities with the Highest Percentage of Population with a Degree in Bio, Nature & Agricultural in Illinois
0.0%
100.0%
Cities with the Highest Percentage of Population with a Degree in Bio, Nature & Agricultural in Illinois
| City | % Graduates | vs State | vs National | |
| 1. | Goofy Ridge | 100.0% | 5.7%(+94.3)#1 | 6.4%(+93.6)#31 |
| 2. | Garrett | 100.0% | 5.7%(+94.3)#2 | 6.4%(+93.6)#62 |
| 3. | Topeka | 100.0% | 5.7%(+94.3)#3 | 6.4%(+93.6)#93 |
| 4. | Hooppole | 87.5% | 5.7%(+81.8)#4 | 6.4%(+81.1)#120 |
| 5. | Jewett | 70.0% | 5.7%(+64.3)#5 | 6.4%(+63.6)#176 |
| 6. | Fayetteville | 63.0% | 5.7%(+57.2)#6 | 6.4%(+56.6)#219 |
| 7. | Coffeen | 53.0% | 5.7%(+47.3)#7 | 6.4%(+46.7)#290 |
| 8. | Beverly | 51.4% | 5.7%(+45.7)#8 | 6.4%(+45.1)#309 |
| 9. | Custer Park | 50.0% | 5.7%(+44.3)#9 | 6.4%(+43.6)#322 |
| 10. | Milton | 50.0% | 5.7%(+44.3)#10 | 6.4%(+43.6)#332 |
| 11. | Wilton Center | 47.6% | 5.7%(+41.9)#11 | 6.4%(+41.3)#399 |
| 12. | Stonefort | 44.4% | 5.7%(+38.7)#12 | 6.4%(+38.1)#444 |
| 13. | Vienna | 42.6% | 5.7%(+36.9)#13 | 6.4%(+36.2)#480 |
| 14. | Creal Springs | 40.0% | 5.7%(+34.3)#14 | 6.4%(+33.6)#537 |
| 15. | Chapin | 37.8% | 5.7%(+32.1)#15 | 6.4%(+31.5)#616 |
| 16. | Norris | 37.5% | 5.7%(+31.8)#16 | 6.4%(+31.1)#628 |
| 17. | Danvers | 35.8% | 5.7%(+30.1)#17 | 6.4%(+29.5)#682 |
| 18. | Lakewood Shores | 35.7% | 5.7%(+30.0)#18 | 6.4%(+29.4)#684 |
| 19. | Gardner | 34.9% | 5.7%(+29.1)#19 | 6.4%(+28.5)#706 |
| 20. | Amboy | 34.6% | 5.7%(+28.8)#20 | 6.4%(+28.2)#719 |
| 21. | Hopkins Park | 34.0% | 5.7%(+28.2)#21 | 6.4%(+27.6)#736 |
| 22. | Bowen | 33.8% | 5.7%(+28.0)#22 | 6.4%(+27.4)#741 |
| 23. | Cabery | 33.3% | 5.7%(+27.6)#23 | 6.4%(+27.0)#765 |
| 24. | Maquon | 33.3% | 5.7%(+27.6)#24 | 6.4%(+27.0)#774 |
| 25. | Waggoner | 33.3% | 5.7%(+27.6)#25 | 6.4%(+27.0)#788 |
| 26. | Walshville | 33.3% | 5.7%(+27.6)#26 | 6.4%(+27.0)#789 |
| 27. | Media | 33.3% | 5.7%(+27.6)#27 | 6.4%(+27.0)#798 |
| 28. | Foosland | 33.3% | 5.7%(+27.6)#28 | 6.4%(+27.0)#830 |
| 29. | Ste Marie | 31.6% | 5.7%(+25.8)#29 | 6.4%(+25.2)#885 |
| 30. | Baileyville | 31.4% | 5.7%(+25.7)#30 | 6.4%(+25.1)#895 |
| 31. | Walnut | 30.9% | 5.7%(+25.2)#31 | 6.4%(+24.6)#924 |
| 32. | Central City | 30.8% | 5.7%(+25.0)#32 | 6.4%(+24.4)#929 |
| 33. | Flat Rock | 30.8% | 5.7%(+25.0)#33 | 6.4%(+24.4)#931 |
| 34. | Preemption | 30.8% | 5.7%(+25.0)#34 | 6.4%(+24.4)#940 |
| 35. | Muncie | 30.6% | 5.7%(+24.8)#35 | 6.4%(+24.2)#949 |
| 36. | Brussels | 30.6% | 5.7%(+24.8)#36 | 6.4%(+24.2)#950 |
| 37. | Ivesdale | 29.7% | 5.7%(+24.0)#37 | 6.4%(+23.4)#1,004 |
| 38. | Sawyerville | 29.2% | 5.7%(+23.4)#38 | 6.4%(+22.8)#1,031 |
| 39. | Kings | 28.6% | 5.7%(+22.8)#39 | 6.4%(+22.2)#1,053 |
| 40. | Indianola | 28.6% | 5.7%(+22.8)#40 | 6.4%(+22.2)#1,060 |
| 41. | Flora | 28.3% | 5.7%(+22.6)#41 | 6.4%(+22.0)#1,087 |
| 42. | New Grand Chain | 27.8% | 5.7%(+22.0)#42 | 6.4%(+21.4)#1,120 |
| 43. | Columbus | 27.8% | 5.7%(+22.0)#43 | 6.4%(+21.4)#1,123 |
| 44. | Union Hill | 27.8% | 5.7%(+22.0)#44 | 6.4%(+21.4)#1,124 |
| 45. | Gillespie | 27.5% | 5.7%(+21.8)#45 | 6.4%(+21.2)#1,137 |
| 46. | Bonnie Brae | 27.4% | 5.7%(+21.7)#46 | 6.4%(+21.1)#1,142 |
| 47. | Hettick | 26.7% | 5.7%(+20.9)#47 | 6.4%(+20.3)#1,214 |
| 48. | Ohlman | 26.7% | 5.7%(+20.9)#48 | 6.4%(+20.3)#1,218 |
| 49. | Orangeville | 26.2% | 5.7%(+20.5)#49 | 6.4%(+19.9)#1,256 |
| 50. | Rosiclare | 26.0% | 5.7%(+20.2)#50 | 6.4%(+19.6)#1,273 |
| 51. | Rock City | 25.9% | 5.7%(+20.2)#51 | 6.4%(+19.6)#1,276 |
| 52. | Windsor | 25.7% | 5.7%(+20.0)#52 | 6.4%(+19.4)#1,292 |
| 53. | Addieville | 25.0% | 5.7%(+19.3)#53 | 6.4%(+18.6)#1,380 |
| 54. | New Canton | 25.0% | 5.7%(+19.3)#54 | 6.4%(+18.6)#1,388 |
| 55. | Mineral | 25.0% | 5.7%(+19.3)#55 | 6.4%(+18.6)#1,398 |
| 56. | Mill Shoals | 25.0% | 5.7%(+19.3)#56 | 6.4%(+18.6)#1,399 |
| 57. | Strawn | 25.0% | 5.7%(+19.3)#57 | 6.4%(+18.6)#1,422 |
| 58. | Kinsman | 25.0% | 5.7%(+19.3)#58 | 6.4%(+18.6)#1,429 |
| 59. | Galatia | 24.7% | 5.7%(+18.9)#59 | 6.4%(+18.3)#1,450 |
| 60. | Flanagan | 24.6% | 5.7%(+18.9)#60 | 6.4%(+18.3)#1,456 |
| 61. | Cambria | 24.3% | 5.7%(+18.5)#61 | 6.4%(+17.9)#1,480 |
| 62. | Old Mill Creek | 24.3% | 5.7%(+18.5)#62 | 6.4%(+17.9)#1,481 |
| 63. | Iuka | 24.1% | 5.7%(+18.4)#63 | 6.4%(+17.8)#1,498 |
| 64. | Ridgewood | 23.9% | 5.7%(+18.1)#64 | 6.4%(+17.5)#1,521 |
| 65. | Chatsworth | 23.7% | 5.7%(+18.0)#65 | 6.4%(+17.4)#1,532 |
| 66. | Lenzburg | 23.7% | 5.7%(+17.9)#66 | 6.4%(+17.3)#1,537 |
| 67. | Farmersville | 23.6% | 5.7%(+17.9)#67 | 6.4%(+17.3)#1,540 |
| 68. | Magnolia | 23.5% | 5.7%(+17.8)#68 | 6.4%(+17.2)#1,561 |
| 69. | West Brooklyn | 23.3% | 5.7%(+17.6)#69 | 6.4%(+17.0)#1,579 |
| 70. | Keithsburg | 23.1% | 5.7%(+17.3)#70 | 6.4%(+16.7)#1,603 |
| 71. | Delavan | 22.8% | 5.7%(+17.1)#71 | 6.4%(+16.5)#1,638 |
| 72. | Beardstown | 22.6% | 5.7%(+16.9)#72 | 6.4%(+16.3)#1,662 |
| 73. | Bellflower | 22.5% | 5.7%(+16.8)#73 | 6.4%(+16.1)#1,674 |
| 74. | Liberty | 22.2% | 5.7%(+16.5)#74 | 6.4%(+15.9)#1,700 |
| 75. | Golden Gate | 22.2% | 5.7%(+16.5)#75 | 6.4%(+15.9)#1,726 |
| 76. | Panola | 22.2% | 5.7%(+16.5)#76 | 6.4%(+15.9)#1,732 |
| 77. | Aledo | 21.6% | 5.7%(+15.9)#77 | 6.4%(+15.3)#1,791 |
| 78. | Morrisonville | 21.4% | 5.7%(+15.7)#78 | 6.4%(+15.1)#1,814 |
| 79. | Dowell | 21.4% | 5.7%(+15.7)#79 | 6.4%(+15.1)#1,820 |
| 80. | Roanoke | 21.3% | 5.7%(+15.5)#80 | 6.4%(+14.9)#1,842 |
| 81. | Elliott | 21.1% | 5.7%(+15.3)#81 | 6.4%(+14.7)#1,876 |
| 82. | St Anne | 20.8% | 5.7%(+15.0)#82 | 6.4%(+14.4)#1,914 |
| 83. | Potomac | 20.6% | 5.7%(+14.8)#83 | 6.4%(+14.2)#1,937 |
| 84. | New Holland | 20.6% | 5.7%(+14.8)#84 | 6.4%(+14.2)#1,940 |
| 85. | Coulterville | 20.2% | 5.7%(+14.4)#85 | 6.4%(+13.8)#1,976 |
| 86. | Ursa | 20.0% | 5.7%(+14.3)#86 | 6.4%(+13.6)#2,013 |
| 87. | Sidell | 20.0% | 5.7%(+14.3)#87 | 6.4%(+13.6)#2,016 |
| 88. | Rutland | 20.0% | 5.7%(+14.3)#88 | 6.4%(+13.6)#2,045 |
| 89. | Bone Gap | 20.0% | 5.7%(+14.3)#89 | 6.4%(+13.6)#2,050 |
| 90. | Arrowsmith | 19.6% | 5.7%(+13.9)#90 | 6.4%(+13.3)#2,129 |
| 91. | Lisbon | 19.5% | 5.7%(+13.8)#91 | 6.4%(+13.2)#2,147 |
| 92. | Bonnie | 19.4% | 5.7%(+13.7)#92 | 6.4%(+13.1)#2,164 |
| 93. | Good Hope | 19.1% | 5.7%(+13.4)#93 | 6.4%(+12.8)#2,223 |
| 94. | Rantoul | 19.0% | 5.7%(+13.3)#94 | 6.4%(+12.7)#2,251 |
| 95. | Hardin | 19.0% | 5.7%(+13.2)#95 | 6.4%(+12.6)#2,258 |
| 96. | Marquette Heights | 18.9% | 5.7%(+13.2)#96 | 6.4%(+12.6)#2,261 |
| 97. | Marseilles | 18.9% | 5.7%(+13.2)#97 | 6.4%(+12.5)#2,279 |
| 98. | Wilsonville | 18.5% | 5.7%(+12.8)#98 | 6.4%(+12.2)#2,344 |
| 99. | Tuscola | 18.5% | 5.7%(+12.7)#99 | 6.4%(+12.1)#2,352 |
| 100. | Benson | 18.4% | 5.7%(+12.7)#100 | 6.4%(+12.1)#2,359 |
Common Questions
What are the Top 10 Cities with the Highest Percentage of Population with a Degree in Bio, Nature & Agricultural in Illinois?
Top 10 Cities with the Highest Percentage of Population with a Degree in Bio, Nature & Agricultural in Illinois are:
#1
100.0%
#2
100.0%
#3
100.0%
#4
87.5%
#5
70.0%
#6
63.0%
#7
53.0%
#8
50.0%
#9
44.4%
#10
42.6%
What city has the Highest Percentage of Population with a Degree in Bio, Nature & Agricultural in Illinois?
Goofy Ridge has the Highest Percentage of Population with a Degree in Bio, Nature & Agricultural in Illinois with 100.0%.
What is the Percentage of Population with a Degree in Bio, Nature & Agricultural in the State of Illinois?
Percentage of Population with a Degree in Bio, Nature & Agricultural in Illinois is 5.7%.
What is the Percentage of Population with a Degree in Bio, Nature & Agricultural in the United States?
Percentage of Population with a Degree in Bio, Nature & Agricultural in the United States is 6.4%.