Cities with the Highest Percentage of Population with a Degree in Bio, Nature & Agricultural in Connecticut
RELATED REPORTS & OPTIONS
Bio, Nature & Agricultural
Connecticut
Compare Cities
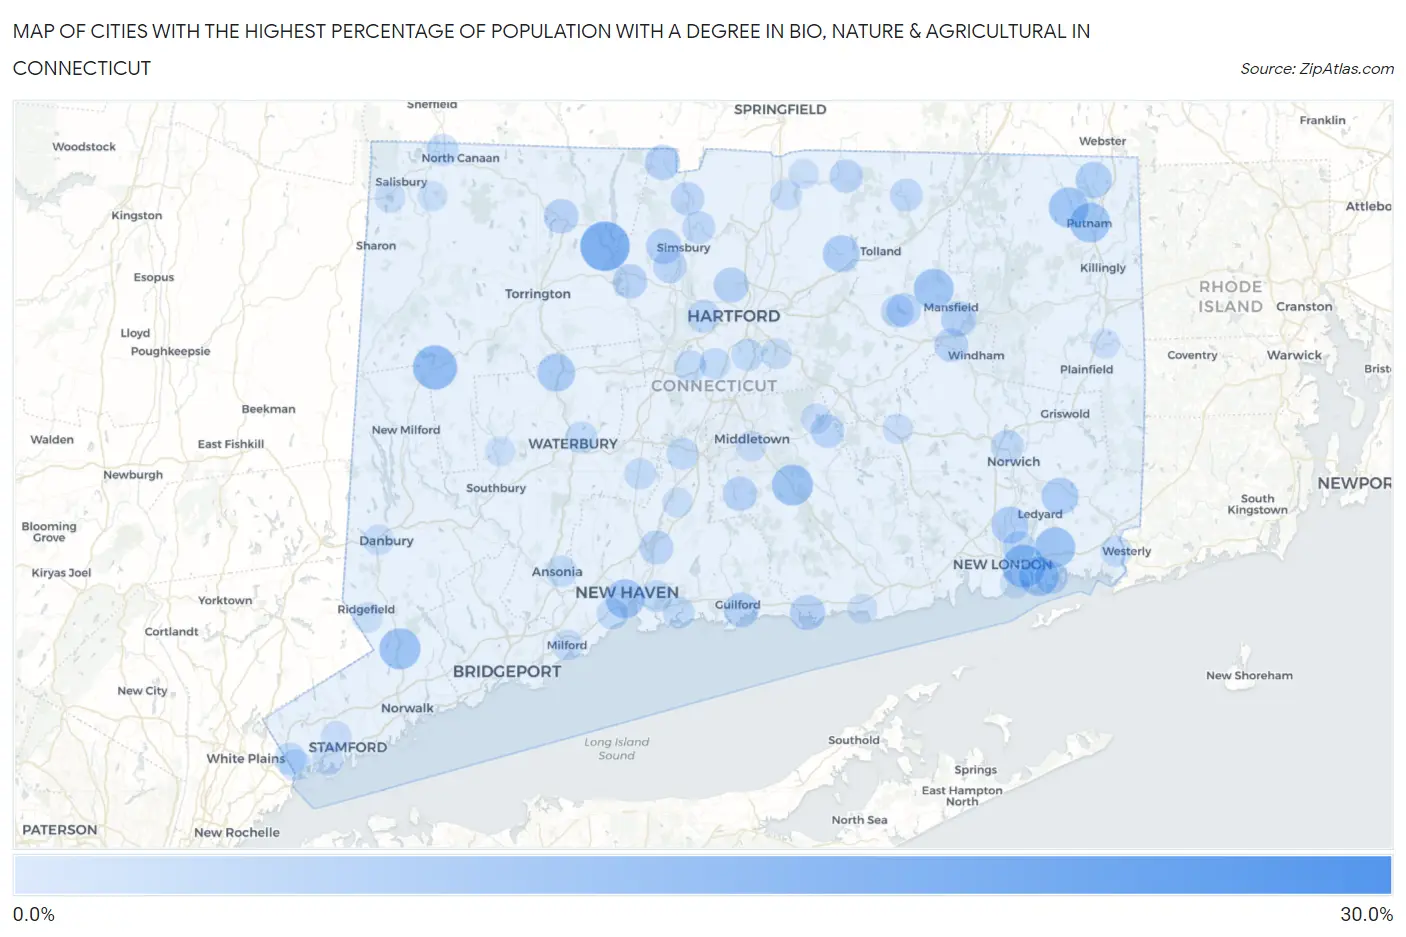
Map of Cities with the Highest Percentage of Population with a Degree in Bio, Nature & Agricultural in Connecticut
0.0%
30.0%
Cities with the Highest Percentage of Population with a Degree in Bio, Nature & Agricultural in Connecticut
| City | % Graduates | vs State | vs National | |
| 1. | Mechanicsville | 29.6% | 5.5%(+24.2)#1 | 6.4%(+23.3)#1,009 |
| 2. | Hawleyville | 26.7% | 5.5%(+21.2)#2 | 6.4%(+20.3)#1,213 |
| 3. | Dodgingtown | 23.3% | 5.5%(+17.9)#3 | 6.4%(+17.0)#1,580 |
| 4. | New Hartford Center | 18.9% | 5.5%(+13.5)#4 | 6.4%(+12.6)#2,260 |
| 5. | Lakes West | 17.0% | 5.5%(+11.5)#5 | 6.4%(+10.6)#2,643 |
| 6. | New Preston | 14.9% | 5.5%(+9.40)#6 | 6.4%(+8.52)#3,276 |
| 7. | Long Hill | 13.8% | 5.5%(+8.36)#7 | 6.4%(+7.48)#3,711 |
| 8. | Murray | 13.3% | 5.5%(+7.78)#8 | 6.4%(+6.90)#3,967 |
| 9. | Cannondale | 12.6% | 5.5%(+7.08)#9 | 6.4%(+6.20)#4,279 |
| 10. | Higganum | 12.4% | 5.5%(+6.94)#10 | 6.4%(+6.06)#4,406 |
| 11. | Candlewood Isle | 12.2% | 5.5%(+6.76)#11 | 6.4%(+5.88)#4,491 |
| 12. | Old Mystic | 12.1% | 5.5%(+6.66)#12 | 6.4%(+5.78)#4,539 |
| 13. | Sail Harbor | 12.1% | 5.5%(+6.59)#13 | 6.4%(+5.72)#4,581 |
| 14. | South Woodstock | 11.8% | 5.5%(+6.32)#14 | 6.4%(+5.44)#4,723 |
| 15. | Storrs | 11.7% | 5.5%(+6.22)#15 | 6.4%(+5.34)#4,793 |
| 16. | Putnam | 11.7% | 5.5%(+6.18)#16 | 6.4%(+5.31)#4,807 |
| 17. | Botsford | 11.5% | 5.5%(+6.04)#17 | 6.4%(+5.16)#4,889 |
| 18. | Poquonock Bridge | 11.5% | 5.5%(+5.99)#18 | 6.4%(+5.11)#4,933 |
| 19. | Sacred Heart University | 11.1% | 5.5%(+5.64)#19 | 6.4%(+4.76)#5,114 |
| 20. | New Haven | 11.0% | 5.5%(+5.49)#20 | 6.4%(+4.61)#5,246 |
| 21. | Thomaston | 10.2% | 5.5%(+4.76)#21 | 6.4%(+3.88)#5,809 |
| 22. | Lakes East | 9.6% | 5.5%(+4.15)#22 | 6.4%(+3.27)#6,316 |
| 23. | Mashantucket | 9.5% | 5.5%(+4.05)#23 | 6.4%(+3.17)#6,426 |
| 24. | Gales Ferry | 9.5% | 5.5%(+3.98)#24 | 6.4%(+3.11)#6,480 |
| 25. | Rockville | 9.4% | 5.5%(+3.94)#25 | 6.4%(+3.06)#6,533 |
| 26. | Fenwick Borough | 9.4% | 5.5%(+3.90)#26 | 6.4%(+3.02)#6,575 |
| 27. | North Grosvenor Dale | 9.0% | 5.5%(+3.55)#27 | 6.4%(+2.67)#6,931 |
| 28. | Mansfield Center | 8.3% | 5.5%(+2.78)#28 | 6.4%(+1.90)#7,874 |
| 29. | Clinton | 8.2% | 5.5%(+2.75)#29 | 6.4%(+1.87)#7,911 |
| 30. | West Simsbury | 8.2% | 5.5%(+2.70)#30 | 6.4%(+1.83)#7,967 |
| 31. | North Granby | 8.1% | 5.5%(+2.64)#31 | 6.4%(+1.76)#8,040 |
| 32. | Blue Hills | 8.1% | 5.5%(+2.62)#32 | 6.4%(+1.74)#8,079 |
| 33. | Guilford Center | 7.9% | 5.5%(+2.42)#33 | 6.4%(+1.54)#8,357 |
| 34. | Lordship | 7.8% | 5.5%(+2.35)#34 | 6.4%(+1.48)#8,441 |
| 35. | Ball Pond | 7.7% | 5.5%(+2.23)#35 | 6.4%(+1.35)#8,632 |
| 36. | Winsted | 7.7% | 5.5%(+2.18)#36 | 6.4%(+1.30)#8,760 |
| 37. | Collinsville | 7.5% | 5.5%(+2.01)#37 | 6.4%(+1.13)#8,998 |
| 38. | Durham | 7.5% | 5.5%(+2.00)#38 | 6.4%(+1.12)#9,005 |
| 39. | North Haven | 7.4% | 5.5%(+1.93)#39 | 6.4%(+1.05)#9,145 |
| 40. | South Coventry | 7.2% | 5.5%(+1.70)#40 | 6.4%(+0.823)#9,442 |
| 41. | Willimantic | 7.0% | 5.5%(+1.57)#41 | 6.4%(+0.694)#9,655 |
| 42. | Weatogue | 6.9% | 5.5%(+1.41)#42 | 6.4%(+0.533)#9,925 |
| 43. | Somers | 6.8% | 5.5%(+1.34)#43 | 6.4%(+0.462)#10,058 |
| 44. | East Hampton | 6.8% | 5.5%(+1.30)#44 | 6.4%(+0.426)#10,112 |
| 45. | Old Hill | 6.7% | 5.5%(+1.27)#45 | 6.4%(+0.392)#10,162 |
| 46. | Salmon Brook | 6.7% | 5.5%(+1.20)#46 | 6.4%(+0.325)#10,251 |
| 47. | Noank | 6.7% | 5.5%(+1.20)#47 | 6.4%(+0.320)#10,255 |
| 48. | West Hartford | 6.5% | 5.5%(+1.06)#48 | 6.4%(+0.178)#10,522 |
| 49. | Coventry Lake | 6.5% | 5.5%(+1.04)#49 | 6.4%(+0.157)#10,564 |
| 50. | Tariffville | 6.5% | 5.5%(+1.02)#50 | 6.4%(+0.140)#10,587 |
| 51. | Stafford Springs | 6.4% | 5.5%(+0.972)#51 | 6.4%(+0.094)#10,677 |
| 52. | Norwich | 6.4% | 5.5%(+0.909)#52 | 6.4%(+0.031)#10,769 |
| 53. | Conning Towers Nautilus Park | 6.4% | 5.5%(+0.890)#53 | 6.4%(+0.012)#10,809 |
| 54. | Plattsville | 6.3% | 5.5%(+0.791)#54 | 6.4%(-0.087)#10,990 |
| 55. | Stonington Borough | 6.1% | 5.5%(+0.633)#55 | 6.4%(-0.245)#11,332 |
| 56. | Woodmont Borough | 6.1% | 5.5%(+0.606)#56 | 6.4%(-0.272)#11,390 |
| 57. | Northford | 6.1% | 5.5%(+0.580)#57 | 6.4%(-0.298)#11,452 |
| 58. | Waterbury | 5.9% | 5.5%(+0.452)#58 | 6.4%(-0.426)#11,704 |
| 59. | East Haven | 5.9% | 5.5%(+0.418)#59 | 6.4%(-0.460)#11,755 |
| 60. | Trumbull Center | 5.9% | 5.5%(+0.416)#60 | 6.4%(-0.462)#11,758 |
| 61. | Wethersfield | 5.9% | 5.5%(+0.399)#61 | 6.4%(-0.479)#11,834 |
| 62. | Glenville | 5.9% | 5.5%(+0.382)#62 | 6.4%(-0.496)#11,858 |
| 63. | Meriden | 5.9% | 5.5%(+0.375)#63 | 6.4%(-0.503)#11,875 |
| 64. | Canaan | 5.8% | 5.5%(+0.314)#64 | 6.4%(-0.564)#11,984 |
| 65. | Branford Center | 5.8% | 5.5%(+0.292)#65 | 6.4%(-0.586)#12,035 |
| 66. | Staples | 5.8% | 5.5%(+0.289)#66 | 6.4%(-0.590)#12,042 |
| 67. | New Britain | 5.8% | 5.5%(+0.287)#67 | 6.4%(-0.591)#12,044 |
| 68. | Oronoque | 5.6% | 5.5%(+0.161)#68 | 6.4%(-0.717)#12,295 |
| 69. | Pemberwick | 5.6% | 5.5%(+0.087)#69 | 6.4%(-0.791)#12,449 |
| 70. | Tashua | 5.5% | 5.5%(+0.029)#70 | 6.4%(-0.849)#12,571 |
| 71. | Pawcatuck | 5.5% | 5.5%(-0.017)#71 | 6.4%(-0.895)#12,673 |
| 72. | Ansonia | 5.5% | 5.5%(-0.017)#72 | 6.4%(-0.895)#12,675 |
| 73. | Cheshire Village | 5.4% | 5.5%(-0.078)#73 | 6.4%(-0.956)#12,804 |
| 74. | West Haven | 5.4% | 5.5%(-0.093)#74 | 6.4%(-0.971)#12,832 |
| 75. | Knollcrest | 5.3% | 5.5%(-0.150)#75 | 6.4%(-1.03)#12,952 |
| 76. | Newington | 5.3% | 5.5%(-0.162)#76 | 6.4%(-1.04)#12,979 |
| 77. | Naugatuck Borough | 5.2% | 5.5%(-0.255)#77 | 6.4%(-1.13)#13,209 |
| 78. | Litchfield Borough | 5.2% | 5.5%(-0.257)#78 | 6.4%(-1.13)#13,212 |
| 79. | Southwood Acres | 5.2% | 5.5%(-0.258)#79 | 6.4%(-1.14)#13,215 |
| 80. | Danbury | 5.0% | 5.5%(-0.434)#80 | 6.4%(-1.31)#13,579 |
| 81. | Milford City Balance | 4.9% | 5.5%(-0.540)#81 | 6.4%(-1.42)#13,811 |
| 82. | Glastonbury Center | 4.9% | 5.5%(-0.573)#82 | 6.4%(-1.45)#13,871 |
| 83. | Lake Pocotopaug | 4.8% | 5.5%(-0.638)#83 | 6.4%(-1.52)#14,026 |
| 84. | Riverside | 4.8% | 5.5%(-0.649)#84 | 6.4%(-1.53)#14,051 |
| 85. | Ridgefield | 4.8% | 5.5%(-0.682)#85 | 6.4%(-1.56)#14,133 |
| 86. | Noroton Heights | 4.8% | 5.5%(-0.705)#86 | 6.4%(-1.58)#14,171 |
| 87. | Middletown | 4.7% | 5.5%(-0.758)#87 | 6.4%(-1.64)#14,327 |
| 88. | Saugatuck | 4.7% | 5.5%(-0.803)#88 | 6.4%(-1.68)#14,435 |
| 89. | Lakeville | 4.7% | 5.5%(-0.804)#89 | 6.4%(-1.68)#14,436 |
| 90. | Stamford | 4.6% | 5.5%(-0.864)#90 | 6.4%(-1.74)#14,564 |
| 91. | Colchester | 4.5% | 5.5%(-0.936)#91 | 6.4%(-1.81)#14,737 |
| 92. | Wallingford Center | 4.5% | 5.5%(-1.01)#92 | 6.4%(-1.88)#14,872 |
| 93. | Danielson Borough | 4.5% | 5.5%(-1.02)#93 | 6.4%(-1.90)#14,905 |
| 94. | Woodbury Center | 4.4% | 5.5%(-1.03)#94 | 6.4%(-1.91)#14,929 |
| 95. | Saybrook Manor | 4.4% | 5.5%(-1.04)#95 | 6.4%(-1.92)#14,956 |
| 96. | Groton | 4.3% | 5.5%(-1.15)#96 | 6.4%(-2.02)#15,194 |
| 97. | Hazardville | 4.3% | 5.5%(-1.15)#97 | 6.4%(-2.02)#15,196 |
| 98. | Falls Village | 4.3% | 5.5%(-1.15)#98 | 6.4%(-2.03)#15,207 |
| 99. | Moosup | 4.3% | 5.5%(-1.21)#99 | 6.4%(-2.09)#15,332 |
| 100. | Ridgebury | 4.2% | 5.5%(-1.24)#100 | 6.4%(-2.12)#15,381 |
Common Questions
What are the Top 10 Cities with the Highest Percentage of Population with a Degree in Bio, Nature & Agricultural in Connecticut?
Top 10 Cities with the Highest Percentage of Population with a Degree in Bio, Nature & Agricultural in Connecticut are:
#1
18.9%
#2
14.9%
#3
13.8%
#4
12.6%
#5
12.4%
#6
12.1%
#7
11.8%
#8
11.7%
#9
11.7%
#10
11.5%
What city has the Highest Percentage of Population with a Degree in Bio, Nature & Agricultural in Connecticut?
New Hartford Center has the Highest Percentage of Population with a Degree in Bio, Nature & Agricultural in Connecticut with 18.9%.
What is the Percentage of Population with a Degree in Bio, Nature & Agricultural in the State of Connecticut?
Percentage of Population with a Degree in Bio, Nature & Agricultural in Connecticut is 5.5%.
What is the Percentage of Population with a Degree in Bio, Nature & Agricultural in the United States?
Percentage of Population with a Degree in Bio, Nature & Agricultural in the United States is 6.4%.