Cities with the Highest Percentage of Population with a Degree in Bio, Nature & Agricultural in Vermont
RELATED REPORTS & OPTIONS
Bio, Nature & Agricultural
Vermont
Compare Cities
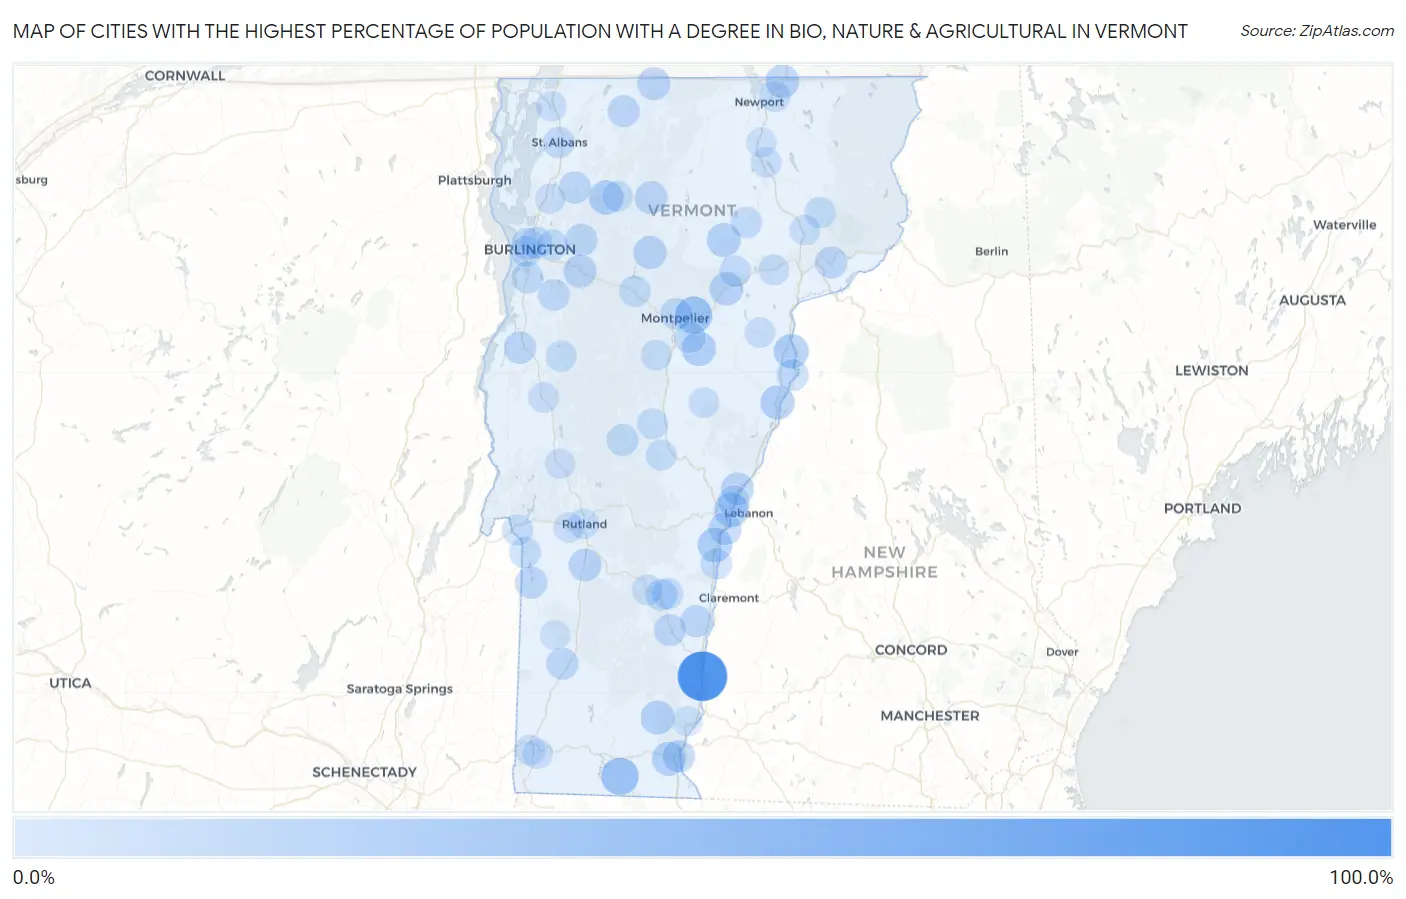
Map of Cities with the Highest Percentage of Population with a Degree in Bio, Nature & Agricultural in Vermont
0.0%
100.0%
Cities with the Highest Percentage of Population with a Degree in Bio, Nature & Agricultural in Vermont
| City | % Graduates | vs State | vs National | |
| 1. | North Westminster | 87.2% | 8.9%(+78.3)#1 | 6.4%(+80.8)#121 |
| 2. | Huntington Center | 55.2% | 8.9%(+46.4)#2 | 6.4%(+48.9)#270 |
| 3. | Sheffield | 44.4% | 8.9%(+35.6)#3 | 6.4%(+38.1)#446 |
| 4. | Underhill Center | 34.5% | 8.9%(+25.7)#4 | 6.4%(+28.2)#720 |
| 5. | Jacksonville | 33.3% | 8.9%(+24.5)#5 | 6.4%(+27.0)#770 |
| 6. | East Montpelier | 32.6% | 8.9%(+23.7)#6 | 6.4%(+26.2)#847 |
| 7. | Chittenden | 30.0% | 8.9%(+21.1)#7 | 6.4%(+23.6)#986 |
| 8. | Bolton | 28.6% | 8.9%(+19.7)#8 | 6.4%(+22.2)#1,081 |
| 9. | East Poultney | 24.1% | 8.9%(+15.2)#9 | 6.4%(+17.7)#1,507 |
| 10. | Pawlet | 23.5% | 8.9%(+14.7)#10 | 6.4%(+17.2)#1,558 |
| 11. | Wells River | 22.5% | 8.9%(+13.6)#11 | 6.4%(+16.1)#1,675 |
| 12. | White River Junction | 21.7% | 8.9%(+12.8)#12 | 6.4%(+15.3)#1,786 |
| 13. | Hartland | 21.5% | 8.9%(+12.7)#13 | 6.4%(+15.2)#1,803 |
| 14. | Cambridge | 21.4% | 8.9%(+12.6)#14 | 6.4%(+15.1)#1,823 |
| 15. | Websterville | 20.8% | 8.9%(+12.0)#15 | 6.4%(+14.5)#1,912 |
| 16. | Bradford | 20.1% | 8.9%(+11.2)#16 | 6.4%(+13.7)#1,989 |
| 17. | Sutton | 20.0% | 8.9%(+11.1)#17 | 6.4%(+13.6)#2,062 |
| 18. | Westford | 19.6% | 8.9%(+10.7)#18 | 6.4%(+13.2)#2,139 |
| 19. | Hardwick | 19.5% | 8.9%(+10.7)#19 | 6.4%(+13.2)#2,144 |
| 20. | Newfane | 18.9% | 8.9%(+10.0)#20 | 6.4%(+12.5)#2,283 |
| 21. | West Brattleboro | 18.8% | 8.9%(+9.98)#21 | 6.4%(+12.5)#2,290 |
| 22. | Derby Line | 17.6% | 8.9%(+8.74)#22 | 6.4%(+11.2)#2,534 |
| 23. | South Lincoln | 17.0% | 8.9%(+8.13)#23 | 6.4%(+10.6)#2,647 |
| 24. | Marshfield | 16.8% | 8.9%(+7.96)#24 | 6.4%(+10.5)#2,680 |
| 25. | Lincoln | 16.1% | 8.9%(+7.24)#25 | 6.4%(+9.74)#2,934 |
| 26. | Stowe | 15.9% | 8.9%(+7.05)#26 | 6.4%(+9.55)#2,980 |
| 27. | Richmond | 15.3% | 8.9%(+6.45)#27 | 6.4%(+8.94)#3,160 |
| 28. | Richford | 15.1% | 8.9%(+6.26)#28 | 6.4%(+8.76)#3,212 |
| 29. | North Hartland | 14.8% | 8.9%(+5.90)#29 | 6.4%(+8.40)#3,309 |
| 30. | Wallingford | 14.6% | 8.9%(+5.74)#30 | 6.4%(+8.24)#3,359 |
| 31. | Johnson | 14.3% | 8.9%(+5.43)#31 | 6.4%(+7.93)#3,478 |
| 32. | Norwich | 14.3% | 8.9%(+5.43)#32 | 6.4%(+7.93)#3,486 |
| 33. | South Londonderry | 14.3% | 8.9%(+5.43)#33 | 6.4%(+7.93)#3,530 |
| 34. | East Dorset | 13.8% | 8.9%(+4.94)#34 | 6.4%(+7.44)#3,735 |
| 35. | Middletown Springs | 13.6% | 8.9%(+4.78)#35 | 6.4%(+7.28)#3,796 |
| 36. | Danby | 13.3% | 8.9%(+4.48)#36 | 6.4%(+6.98)#3,932 |
| 37. | Jericho | 13.2% | 8.9%(+4.33)#37 | 6.4%(+6.83)#3,999 |
| 38. | Brattleboro | 12.9% | 8.9%(+4.06)#38 | 6.4%(+6.56)#4,118 |
| 39. | Vergennes | 12.6% | 8.9%(+3.74)#39 | 6.4%(+6.24)#4,267 |
| 40. | Bolton Valley | 12.5% | 8.9%(+3.65)#40 | 6.4%(+6.15)#4,364 |
| 41. | Fairfax | 12.2% | 8.9%(+3.33)#41 | 6.4%(+5.82)#4,523 |
| 42. | Enosburg Falls | 12.0% | 8.9%(+3.15)#42 | 6.4%(+5.65)#4,611 |
| 43. | Wells | 11.8% | 8.9%(+2.91)#43 | 6.4%(+5.41)#4,743 |
| 44. | Algiers | 11.8% | 8.9%(+2.91)#44 | 6.4%(+5.41)#4,755 |
| 45. | Concord | 11.6% | 8.9%(+2.78)#45 | 6.4%(+5.27)#4,831 |
| 46. | Springfield | 11.6% | 8.9%(+2.74)#46 | 6.4%(+5.24)#4,839 |
| 47. | Chester | 11.4% | 8.9%(+2.56)#47 | 6.4%(+5.05)#4,960 |
| 48. | Manchester | 11.2% | 8.9%(+2.33)#48 | 6.4%(+4.83)#5,081 |
| 49. | Burlington | 11.1% | 8.9%(+2.21)#49 | 6.4%(+4.71)#5,202 |
| 50. | Newbury | 11.0% | 8.9%(+2.11)#50 | 6.4%(+4.61)#5,249 |
| 51. | North Pownal | 10.8% | 8.9%(+1.99)#51 | 6.4%(+4.49)#5,341 |
| 52. | Rochester | 10.4% | 8.9%(+1.58)#52 | 6.4%(+4.08)#5,667 |
| 53. | Winooski | 10.3% | 8.9%(+1.50)#53 | 6.4%(+3.99)#5,710 |
| 54. | Hinesburg | 10.3% | 8.9%(+1.40)#54 | 6.4%(+3.90)#5,784 |
| 55. | Wilder | 10.0% | 8.9%(+1.17)#55 | 6.4%(+3.67)#5,941 |
| 56. | Shelburne | 9.9% | 8.9%(+1.08)#56 | 6.4%(+3.58)#6,050 |
| 57. | Peacham | 9.9% | 8.9%(+1.01)#57 | 6.4%(+3.51)#6,110 |
| 58. | Montpelier | 9.8% | 8.9%(+0.978)#58 | 6.4%(+3.48)#6,129 |
| 59. | Proctorsville | 9.8% | 8.9%(+0.952)#59 | 6.4%(+3.45)#6,155 |
| 60. | Waterbury | 9.6% | 8.9%(+0.779)#60 | 6.4%(+3.28)#6,312 |
| 61. | St Albans | 9.5% | 8.9%(+0.615)#61 | 6.4%(+3.11)#6,469 |
| 62. | West Woodstock | 9.4% | 8.9%(+0.569)#62 | 6.4%(+3.07)#6,521 |
| 63. | Cavendish | 9.4% | 8.9%(+0.523)#63 | 6.4%(+3.02)#6,571 |
| 64. | Poultney | 9.0% | 8.9%(+0.114)#64 | 6.4%(+2.61)#6,988 |
| 65. | South Burlington | 8.9% | 8.9%(+0.013)#65 | 6.4%(+2.51)#7,109 |
| 66. | Barre | 8.8% | 8.9%(-0.062)#66 | 6.4%(+2.44)#7,194 |
| 67. | Cabot | 8.5% | 8.9%(-0.341)#67 | 6.4%(+2.16)#7,533 |
| 68. | Greensboro Bend | 8.5% | 8.9%(-0.377)#68 | 6.4%(+2.12)#7,576 |
| 69. | Derby Center | 8.3% | 8.9%(-0.518)#69 | 6.4%(+1.98)#7,733 |
| 70. | Windsor | 8.3% | 8.9%(-0.556)#70 | 6.4%(+1.94)#7,830 |
| 71. | East Burke | 8.2% | 8.9%(-0.633)#71 | 6.4%(+1.87)#7,921 |
| 72. | Fair Haven | 8.0% | 8.9%(-0.852)#72 | 6.4%(+1.65)#8,178 |
| 73. | South Hero | 8.0% | 8.9%(-0.852)#73 | 6.4%(+1.65)#8,209 |
| 74. | St. George | 7.8% | 8.9%(-1.07)#74 | 6.4%(+1.42)#8,527 |
| 75. | Randolph | 7.5% | 8.9%(-1.33)#75 | 6.4%(+1.17)#8,948 |
| 76. | Essex Junction | 7.4% | 8.9%(-1.48)#76 | 6.4%(+1.02)#9,173 |
| 77. | Killington | 7.3% | 8.9%(-1.55)#77 | 6.4%(+0.946)#9,281 |
| 78. | Bethel | 7.2% | 8.9%(-1.61)#78 | 6.4%(+0.893)#9,341 |
| 79. | Bristol | 7.0% | 8.9%(-1.88)#79 | 6.4%(+0.619)#9,781 |
| 80. | Jeffersonville | 6.8% | 8.9%(-2.06)#80 | 6.4%(+0.443)#10,096 |
| 81. | Ludlow | 6.6% | 8.9%(-2.24)#81 | 6.4%(+0.254)#10,400 |
| 82. | Northfield | 6.6% | 8.9%(-2.27)#82 | 6.4%(+0.228)#10,435 |
| 83. | Middlebury | 6.5% | 8.9%(-2.36)#83 | 6.4%(+0.141)#10,583 |
| 84. | Huntington | 6.4% | 8.9%(-2.42)#84 | 6.4%(+0.082)#10,695 |
| 85. | Danville | 6.2% | 8.9%(-2.64)#85 | 6.4%(-0.139)#11,125 |
| 86. | Lyndonville | 6.2% | 8.9%(-2.69)#86 | 6.4%(-0.192)#11,224 |
| 87. | Groton | 5.8% | 8.9%(-3.02)#87 | 6.4%(-0.520)#11,905 |
| 88. | Chelsea | 5.7% | 8.9%(-3.10)#88 | 6.4%(-0.606)#12,076 |
| 89. | Barton | 5.7% | 8.9%(-3.14)#89 | 6.4%(-0.639)#12,142 |
| 90. | Rutland | 5.7% | 8.9%(-3.20)#90 | 6.4%(-0.698)#12,263 |
| 91. | Townshend | 5.4% | 8.9%(-3.45)#91 | 6.4%(-0.948)#12,794 |
| 92. | Swanton | 5.1% | 8.9%(-3.77)#92 | 6.4%(-1.27)#13,482 |
| 93. | West Rutland | 5.0% | 8.9%(-3.82)#93 | 6.4%(-1.33)#13,615 |
| 94. | Old Bennington | 4.9% | 8.9%(-4.00)#94 | 6.4%(-1.50)#13,984 |
| 95. | Bennington | 4.7% | 8.9%(-4.19)#95 | 6.4%(-1.69)#14,456 |
| 96. | Brandon | 4.7% | 8.9%(-4.20)#96 | 6.4%(-1.70)#14,468 |
| 97. | Milton | 4.3% | 8.9%(-4.56)#97 | 6.4%(-2.06)#15,267 |
| 98. | Putney | 4.2% | 8.9%(-4.66)#98 | 6.4%(-2.16)#15,481 |
| 99. | Orleans | 3.8% | 8.9%(-5.05)#99 | 6.4%(-2.56)#16,364 |
| 100. | Dorset | 3.5% | 8.9%(-5.37)#100 | 6.4%(-2.87)#16,958 |
1
2Common Questions
What are the Top 10 Cities with the Highest Percentage of Population with a Degree in Bio, Nature & Agricultural in Vermont?
Top 10 Cities with the Highest Percentage of Population with a Degree in Bio, Nature & Agricultural in Vermont are:
#1
87.2%
#2
33.3%
#3
32.6%
#4
22.5%
#5
21.7%
#6
21.5%
#7
21.4%
#8
20.8%
#9
20.1%
#10
19.5%
What city has the Highest Percentage of Population with a Degree in Bio, Nature & Agricultural in Vermont?
North Westminster has the Highest Percentage of Population with a Degree in Bio, Nature & Agricultural in Vermont with 87.2%.
What is the Percentage of Population with a Degree in Bio, Nature & Agricultural in the State of Vermont?
Percentage of Population with a Degree in Bio, Nature & Agricultural in Vermont is 8.9%.
What is the Percentage of Population with a Degree in Bio, Nature & Agricultural in the United States?
Percentage of Population with a Degree in Bio, Nature & Agricultural in the United States is 6.4%.