Cities with the Highest Percentage of Population with a Degree in Bio, Nature & Agricultural in Iowa
RELATED REPORTS & OPTIONS
Bio, Nature & Agricultural
Iowa
Compare Cities
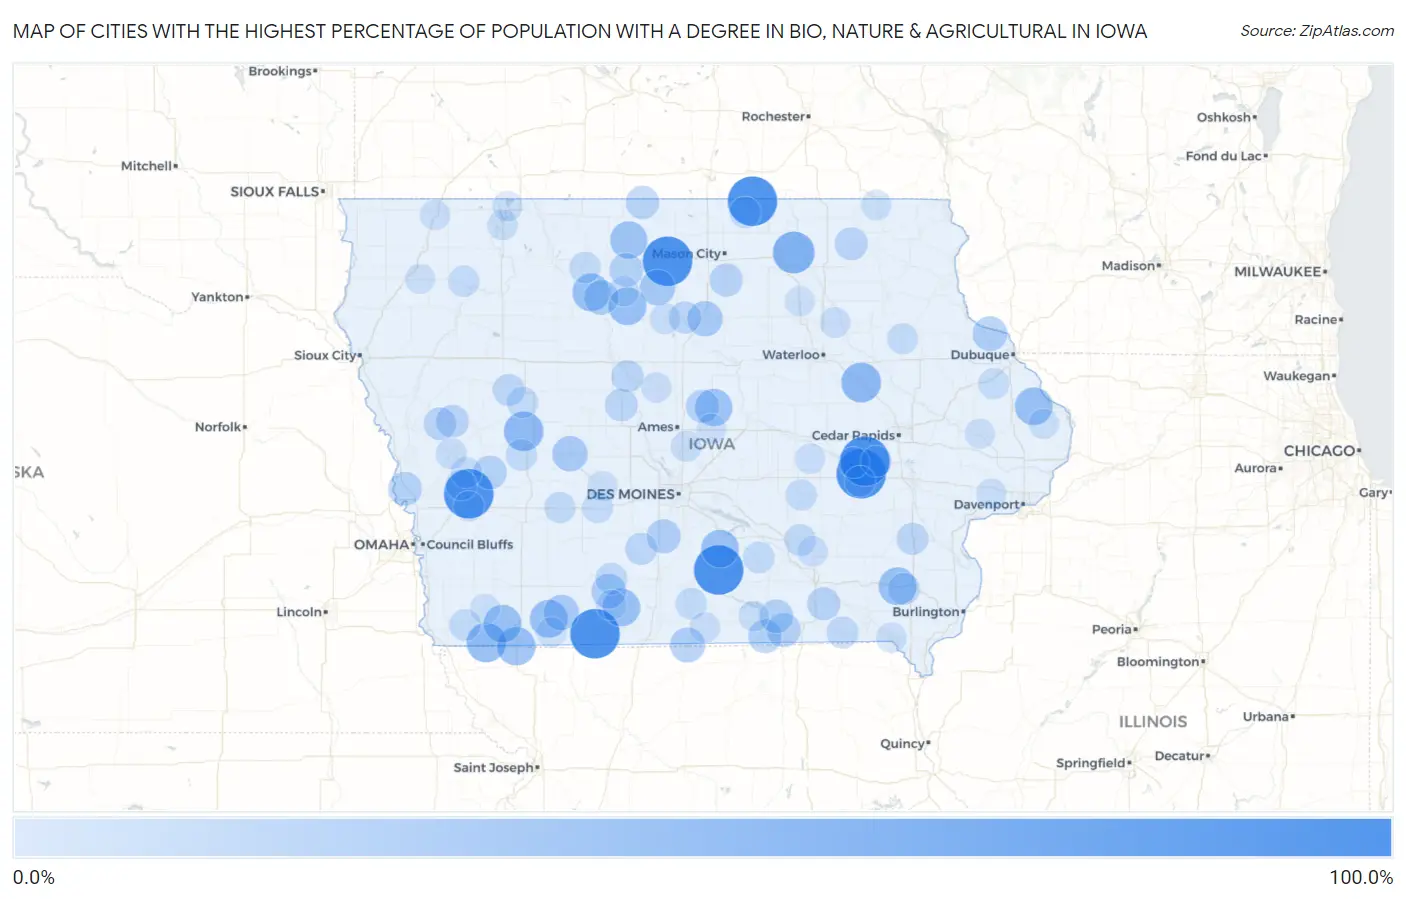
Map of Cities with the Highest Percentage of Population with a Degree in Bio, Nature & Agricultural in Iowa
0.0%
100.0%
Cities with the Highest Percentage of Population with a Degree in Bio, Nature & Agricultural in Iowa
| City | % Graduates | vs State | vs National | |
| 1. | Williamson | 100.0% | 8.9%(+91.1)#1 | 6.4%(+93.6)#42 |
| 2. | Conroy | 100.0% | 8.9%(+91.1)#2 | 6.4%(+93.6)#48 |
| 3. | Duncan | 100.0% | 8.9%(+91.1)#3 | 6.4%(+93.6)#63 |
| 4. | West Amana | 100.0% | 8.9%(+91.1)#4 | 6.4%(+93.6)#66 |
| 5. | Tennant | 100.0% | 8.9%(+91.1)#5 | 6.4%(+93.6)#76 |
| 6. | Delphos | 100.0% | 8.9%(+91.1)#6 | 6.4%(+93.6)#95 |
| 7. | Mona | 100.0% | 8.9%(+91.1)#7 | 6.4%(+93.6)#100 |
| 8. | Colwell | 66.7% | 8.9%(+57.8)#8 | 6.4%(+60.3)#194 |
| 9. | Brandon | 57.9% | 8.9%(+49.0)#9 | 6.4%(+51.5)#254 |
| 10. | Halbur | 57.4% | 8.9%(+48.5)#10 | 6.4%(+51.1)#255 |
| 11. | Northboro | 57.1% | 8.9%(+48.2)#11 | 6.4%(+50.8)#261 |
| 12. | Braddyville | 52.9% | 8.9%(+44.0)#12 | 6.4%(+46.6)#292 |
| 13. | Melcher Dallas | 50.0% | 8.9%(+41.1)#13 | 6.4%(+43.6)#314 |
| 14. | Gravity | 50.0% | 8.9%(+41.1)#14 | 6.4%(+43.6)#337 |
| 15. | Springbrook | 50.0% | 8.9%(+41.1)#15 | 6.4%(+43.6)#344 |
| 16. | Rome | 50.0% | 8.9%(+41.1)#16 | 6.4%(+43.6)#359 |
| 17. | Ellston | 50.0% | 8.9%(+41.1)#17 | 6.4%(+43.6)#369 |
| 18. | Yorktown | 50.0% | 8.9%(+41.1)#18 | 6.4%(+43.6)#371 |
| 19. | Ottosen | 50.0% | 8.9%(+41.1)#19 | 6.4%(+43.6)#373 |
| 20. | Hardy | 50.0% | 8.9%(+41.1)#20 | 6.4%(+43.6)#376 |
| 21. | Zearing | 48.4% | 8.9%(+39.5)#21 | 6.4%(+42.0)#390 |
| 22. | Titonka | 47.9% | 8.9%(+39.0)#22 | 6.4%(+41.6)#395 |
| 23. | Kanawha | 41.7% | 8.9%(+32.8)#23 | 6.4%(+35.4)#495 |
| 24. | Sandusky | 40.5% | 8.9%(+31.6)#24 | 6.4%(+34.2)#525 |
| 25. | Bayard | 40.0% | 8.9%(+31.1)#25 | 6.4%(+33.6)#539 |
| 26. | Coulter | 40.0% | 8.9%(+31.1)#26 | 6.4%(+33.6)#547 |
| 27. | Sharpsburg | 40.0% | 8.9%(+31.1)#27 | 6.4%(+33.6)#567 |
| 28. | Lineville | 38.3% | 8.9%(+29.4)#28 | 6.4%(+31.9)#602 |
| 29. | Arispe | 37.5% | 8.9%(+28.6)#29 | 6.4%(+31.1)#638 |
| 30. | Balltown | 37.5% | 8.9%(+28.6)#30 | 6.4%(+31.1)#639 |
| 31. | Bode | 36.8% | 8.9%(+27.9)#31 | 6.4%(+30.5)#654 |
| 32. | St Marys | 34.8% | 8.9%(+25.9)#32 | 6.4%(+28.4)#711 |
| 33. | Moulton | 34.3% | 8.9%(+25.4)#33 | 6.4%(+28.0)#724 |
| 34. | Modale | 33.3% | 8.9%(+24.4)#34 | 6.4%(+27.0)#769 |
| 35. | Exline | 33.3% | 8.9%(+24.4)#35 | 6.4%(+27.0)#795 |
| 36. | Kirkman | 33.3% | 8.9%(+24.4)#36 | 6.4%(+27.0)#820 |
| 37. | St Benedict | 33.3% | 8.9%(+24.4)#37 | 6.4%(+27.0)#822 |
| 38. | Udell | 33.3% | 8.9%(+24.4)#38 | 6.4%(+27.0)#832 |
| 39. | Rake | 31.4% | 8.9%(+22.5)#39 | 6.4%(+25.1)#894 |
| 40. | Mccallsburg | 31.2% | 8.9%(+22.3)#40 | 6.4%(+24.9)#904 |
| 41. | Rockwell | 30.8% | 8.9%(+21.9)#41 | 6.4%(+24.4)#930 |
| 42. | Floris | 30.8% | 8.9%(+21.9)#42 | 6.4%(+24.4)#939 |
| 43. | Charter Oak | 30.0% | 8.9%(+21.1)#43 | 6.4%(+23.6)#980 |
| 44. | Protivin | 30.0% | 8.9%(+21.1)#44 | 6.4%(+23.6)#981 |
| 45. | Oak Hills | 29.8% | 8.9%(+20.9)#45 | 6.4%(+23.5)#998 |
| 46. | Ute | 29.6% | 8.9%(+20.7)#46 | 6.4%(+23.3)#1,010 |
| 47. | Boxholm | 28.6% | 8.9%(+19.7)#47 | 6.4%(+22.2)#1,067 |
| 48. | Rowan | 27.3% | 8.9%(+18.4)#48 | 6.4%(+20.9)#1,154 |
| 49. | Lehigh | 26.9% | 8.9%(+18.0)#49 | 6.4%(+20.6)#1,176 |
| 50. | East Peru | 26.7% | 8.9%(+17.8)#50 | 6.4%(+20.3)#1,209 |
| 51. | Wall Lake | 26.6% | 8.9%(+17.7)#51 | 6.4%(+20.2)#1,221 |
| 52. | Ainsworth | 26.5% | 8.9%(+17.6)#52 | 6.4%(+20.1)#1,227 |
| 53. | Westwood | 26.5% | 8.9%(+17.6)#53 | 6.4%(+20.1)#1,234 |
| 54. | Milton | 26.3% | 8.9%(+17.4)#54 | 6.4%(+20.0)#1,247 |
| 55. | Keomah Village | 25.6% | 8.9%(+16.7)#55 | 6.4%(+19.2)#1,313 |
| 56. | Afton | 25.3% | 8.9%(+16.4)#56 | 6.4%(+18.9)#1,334 |
| 57. | Farragut | 25.0% | 8.9%(+16.1)#57 | 6.4%(+18.6)#1,368 |
| 58. | Hamilton | 25.0% | 8.9%(+16.1)#58 | 6.4%(+18.6)#1,418 |
| 59. | Carpenter | 25.0% | 8.9%(+16.1)#59 | 6.4%(+18.6)#1,420 |
| 60. | Gray | 25.0% | 8.9%(+16.1)#60 | 6.4%(+18.6)#1,426 |
| 61. | Whittemore | 24.7% | 8.9%(+15.7)#61 | 6.4%(+18.3)#1,453 |
| 62. | Humeston | 24.2% | 8.9%(+15.3)#62 | 6.4%(+17.9)#1,484 |
| 63. | Breda | 24.1% | 8.9%(+15.2)#63 | 6.4%(+17.8)#1,499 |
| 64. | Adair | 23.9% | 8.9%(+15.0)#64 | 6.4%(+17.5)#1,522 |
| 65. | Sutherland | 23.6% | 8.9%(+14.7)#65 | 6.4%(+17.3)#1,542 |
| 66. | Montezuma | 23.6% | 8.9%(+14.7)#66 | 6.4%(+17.2)#1,548 |
| 67. | Stuart | 23.3% | 8.9%(+14.4)#67 | 6.4%(+17.0)#1,573 |
| 68. | Lamont | 22.7% | 8.9%(+13.8)#68 | 6.4%(+16.4)#1,643 |
| 69. | Panama | 22.7% | 8.9%(+13.8)#69 | 6.4%(+16.4)#1,645 |
| 70. | Bernard | 22.7% | 8.9%(+13.8)#70 | 6.4%(+16.4)#1,649 |
| 71. | Marengo | 22.2% | 8.9%(+13.3)#71 | 6.4%(+15.9)#1,692 |
| 72. | Dunlap | 22.2% | 8.9%(+13.3)#72 | 6.4%(+15.9)#1,693 |
| 73. | Portsmouth | 22.2% | 8.9%(+13.3)#73 | 6.4%(+15.9)#1,716 |
| 74. | Amana | 22.2% | 8.9%(+13.3)#74 | 6.4%(+15.8)#1,735 |
| 75. | Clarion | 22.0% | 8.9%(+13.1)#75 | 6.4%(+15.7)#1,748 |
| 76. | Cambridge | 21.8% | 8.9%(+12.9)#76 | 6.4%(+15.5)#1,765 |
| 77. | Williamsburg | 21.6% | 8.9%(+12.6)#77 | 6.4%(+15.2)#1,801 |
| 78. | Fremont | 20.9% | 8.9%(+12.0)#78 | 6.4%(+14.5)#1,896 |
| 79. | Readlyn | 20.9% | 8.9%(+12.0)#79 | 6.4%(+14.5)#1,900 |
| 80. | Milford | 20.7% | 8.9%(+11.8)#80 | 6.4%(+14.4)#1,919 |
| 81. | Allerton | 20.6% | 8.9%(+11.7)#81 | 6.4%(+14.2)#1,938 |
| 82. | Stanhope | 20.3% | 8.9%(+11.4)#82 | 6.4%(+14.0)#1,967 |
| 83. | Preston | 20.1% | 8.9%(+11.2)#83 | 6.4%(+13.8)#1,982 |
| 84. | Sibley | 20.0% | 8.9%(+11.1)#84 | 6.4%(+13.6)#1,993 |
| 85. | Shelby | 20.0% | 8.9%(+11.1)#85 | 6.4%(+13.6)#2,004 |
| 86. | Farmington | 20.0% | 8.9%(+11.1)#86 | 6.4%(+13.6)#2,014 |
| 87. | Holiday Lake | 20.0% | 8.9%(+11.1)#87 | 6.4%(+13.6)#2,024 |
| 88. | Mystic | 20.0% | 8.9%(+11.1)#88 | 6.4%(+13.6)#2,028 |
| 89. | Lu Verne | 20.0% | 8.9%(+11.1)#89 | 6.4%(+13.6)#2,031 |
| 90. | Burr Oak | 20.0% | 8.9%(+11.1)#90 | 6.4%(+13.6)#2,040 |
| 91. | Linden | 20.0% | 8.9%(+11.1)#91 | 6.4%(+13.6)#2,056 |
| 92. | Stockton | 20.0% | 8.9%(+11.1)#92 | 6.4%(+13.6)#2,063 |
| 93. | Bedford | 19.7% | 8.9%(+10.8)#93 | 6.4%(+13.3)#2,122 |
| 94. | Colo | 19.5% | 8.9%(+10.6)#94 | 6.4%(+13.2)#2,145 |
| 95. | Plainfield | 19.4% | 8.9%(+10.4)#95 | 6.4%(+13.0)#2,178 |
| 96. | Essex | 19.2% | 8.9%(+10.3)#96 | 6.4%(+12.9)#2,195 |
| 97. | Tingley | 19.2% | 8.9%(+10.3)#97 | 6.4%(+12.9)#2,205 |
| 98. | Orleans | 19.2% | 8.9%(+10.3)#98 | 6.4%(+12.8)#2,211 |
| 99. | Oxford Junction | 19.0% | 8.9%(+10.1)#99 | 6.4%(+12.7)#2,236 |
| 100. | Granville | 19.0% | 8.9%(+10.1)#100 | 6.4%(+12.7)#2,240 |
Common Questions
What are the Top 10 Cities with the Highest Percentage of Population with a Degree in Bio, Nature & Agricultural in Iowa?
Top 10 Cities with the Highest Percentage of Population with a Degree in Bio, Nature & Agricultural in Iowa are:
#1
100.0%
#2
100.0%
#3
100.0%
#4
100.0%
#5
100.0%
#6
100.0%
#7
100.0%
#8
66.7%
#9
57.9%
#10
57.4%
What city has the Highest Percentage of Population with a Degree in Bio, Nature & Agricultural in Iowa?
Williamson has the Highest Percentage of Population with a Degree in Bio, Nature & Agricultural in Iowa with 100.0%.
What is the Percentage of Population with a Degree in Bio, Nature & Agricultural in the State of Iowa?
Percentage of Population with a Degree in Bio, Nature & Agricultural in Iowa is 8.9%.
What is the Percentage of Population with a Degree in Bio, Nature & Agricultural in the United States?
Percentage of Population with a Degree in Bio, Nature & Agricultural in the United States is 6.4%.