Cities with the Highest Percentage of Population with a Degree in Bio, Nature & Agricultural in Delaware
RELATED REPORTS & OPTIONS
Bio, Nature & Agricultural
Delaware
Compare Cities
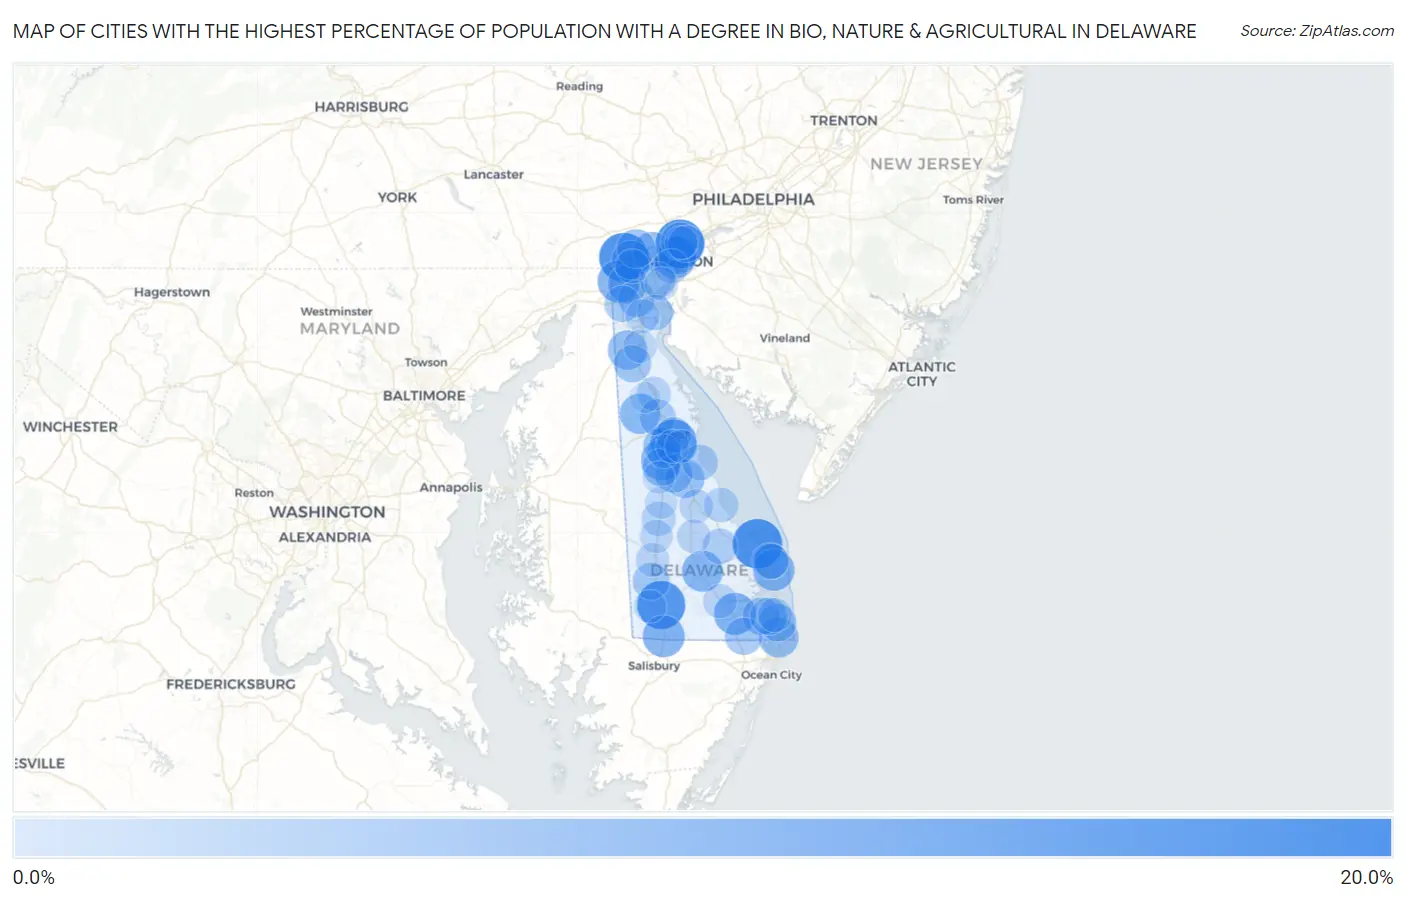
Map of Cities with the Highest Percentage of Population with a Degree in Bio, Nature & Agricultural in Delaware
0.0%
20.0%
Cities with the Highest Percentage of Population with a Degree in Bio, Nature & Agricultural in Delaware
| City | % Graduates | vs State | vs National | |
| 1. | Lewes | 15.4% | 6.2%(+9.18)#1 | 6.4%(+9.08)#3,105 |
| 2. | North Star | 15.2% | 6.2%(+8.91)#2 | 6.4%(+8.81)#3,193 |
| 3. | Ardencroft | 14.7% | 6.2%(+8.43)#3 | 6.4%(+8.33)#3,331 |
| 4. | Laurel | 14.3% | 6.2%(+8.04)#4 | 6.4%(+7.93)#3,468 |
| 5. | Kent Acres | 12.7% | 6.2%(+6.45)#5 | 6.4%(+6.34)#4,213 |
| 6. | Newark | 9.6% | 6.2%(+3.40)#6 | 6.4%(+3.29)#6,291 |
| 7. | Dagsboro | 9.3% | 6.2%(+3.10)#7 | 6.4%(+2.99)#6,598 |
| 8. | Edgemoor | 9.3% | 6.2%(+3.01)#8 | 6.4%(+2.90)#6,689 |
| 9. | Delmar | 9.2% | 6.2%(+2.98)#9 | 6.4%(+2.88)#6,718 |
| 10. | Dewey Beach | 9.0% | 6.2%(+2.72)#10 | 6.4%(+2.62)#6,980 |
| 11. | Georgetown | 8.5% | 6.2%(+2.21)#11 | 6.4%(+2.10)#7,592 |
| 12. | Woodside | 8.3% | 6.2%(+2.08)#12 | 6.4%(+1.98)#7,769 |
| 13. | Kenton | 8.0% | 6.2%(+1.75)#13 | 6.4%(+1.65)#8,199 |
| 14. | Fenwick Island | 7.5% | 6.2%(+1.23)#14 | 6.4%(+1.12)#9,006 |
| 15. | Middletown | 7.1% | 6.2%(+0.875)#15 | 6.4%(+0.771)#9,564 |
| 16. | Brookside | 7.0% | 6.2%(+0.759)#16 | 6.4%(+0.656)#9,727 |
| 17. | Greenville | 6.9% | 6.2%(+0.666)#17 | 6.4%(+0.562)#9,862 |
| 18. | Pike Creek | 6.9% | 6.2%(+0.616)#18 | 6.4%(+0.512)#9,959 |
| 19. | Hockessin | 6.9% | 6.2%(+0.604)#19 | 6.4%(+0.500)#9,971 |
| 20. | Bellefonte | 6.8% | 6.2%(+0.574)#20 | 6.4%(+0.471)#10,024 |
| 21. | Frederica | 6.7% | 6.2%(+0.492)#21 | 6.4%(+0.388)#10,170 |
| 22. | Wyoming | 6.4% | 6.2%(+0.143)#22 | 6.4%(+0.039)#10,757 |
| 23. | Riverview | 6.0% | 6.2%(-0.257)#23 | 6.4%(-0.361)#11,577 |
| 24. | Arden | 6.0% | 6.2%(-0.280)#24 | 6.4%(-0.383)#11,620 |
| 25. | South Bethany | 6.0% | 6.2%(-0.291)#25 | 6.4%(-0.395)#11,644 |
| 26. | Viola | 5.9% | 6.2%(-0.367)#26 | 6.4%(-0.471)#11,827 |
| 27. | Millville | 5.8% | 6.2%(-0.497)#27 | 6.4%(-0.601)#12,062 |
| 28. | Selbyville | 5.7% | 6.2%(-0.573)#28 | 6.4%(-0.677)#12,217 |
| 29. | Ocean View | 5.6% | 6.2%(-0.661)#29 | 6.4%(-0.764)#12,399 |
| 30. | Townsend | 5.5% | 6.2%(-0.738)#30 | 6.4%(-0.842)#12,554 |
| 31. | Seaford | 5.3% | 6.2%(-0.932)#31 | 6.4%(-1.04)#12,966 |
| 32. | Rehoboth Beach | 5.2% | 6.2%(-1.09)#32 | 6.4%(-1.19)#13,339 |
| 33. | Claymont | 5.1% | 6.2%(-1.15)#33 | 6.4%(-1.25)#13,452 |
| 34. | Bear | 4.9% | 6.2%(-1.39)#34 | 6.4%(-1.50)#13,977 |
| 35. | Glasgow | 4.8% | 6.2%(-1.41)#35 | 6.4%(-1.52)#14,031 |
| 36. | Cheswold | 4.8% | 6.2%(-1.44)#36 | 6.4%(-1.54)#14,080 |
| 37. | Wilmington Manor | 4.7% | 6.2%(-1.53)#37 | 6.4%(-1.63)#14,320 |
| 38. | Dover | 4.3% | 6.2%(-1.94)#38 | 6.4%(-2.04)#15,240 |
| 39. | Bowers | 4.3% | 6.2%(-1.95)#39 | 6.4%(-2.05)#15,255 |
| 40. | Delaware City | 4.3% | 6.2%(-1.95)#40 | 6.4%(-2.06)#15,262 |
| 41. | Milton | 4.0% | 6.2%(-2.22)#41 | 6.4%(-2.32)#15,866 |
| 42. | Henlopen Acres | 3.7% | 6.2%(-2.50)#42 | 6.4%(-2.60)#16,465 |
| 43. | Wilmington | 3.4% | 6.2%(-2.84)#43 | 6.4%(-2.95)#17,101 |
| 44. | Slaughter Beach | 3.4% | 6.2%(-2.86)#44 | 6.4%(-2.96)#17,138 |
| 45. | Farmington | 3.3% | 6.2%(-2.97)#45 | 6.4%(-3.07)#17,354 |
| 46. | Bethany Beach | 3.2% | 6.2%(-3.09)#46 | 6.4%(-3.20)#17,578 |
| 47. | Pike Creek Valley | 3.1% | 6.2%(-3.14)#47 | 6.4%(-3.24)#17,655 |
| 48. | Smyrna | 3.1% | 6.2%(-3.20)#48 | 6.4%(-3.30)#17,759 |
| 49. | Camden | 3.0% | 6.2%(-3.30)#49 | 6.4%(-3.40)#17,924 |
| 50. | Millsboro | 2.9% | 6.2%(-3.31)#50 | 6.4%(-3.42)#17,962 |
| 51. | Milford | 2.9% | 6.2%(-3.33)#51 | 6.4%(-3.43)#17,983 |
| 52. | St Georges | 2.9% | 6.2%(-3.36)#52 | 6.4%(-3.46)#18,033 |
| 53. | Ellendale | 2.8% | 6.2%(-3.47)#53 | 6.4%(-3.58)#18,226 |
| 54. | Bridgeville | 2.7% | 6.2%(-3.53)#54 | 6.4%(-3.64)#18,311 |
| 55. | New Castle | 2.5% | 6.2%(-3.75)#55 | 6.4%(-3.86)#18,629 |
| 56. | Greenwood | 2.5% | 6.2%(-3.78)#56 | 6.4%(-3.88)#18,664 |
| 57. | Highland Acres | 2.4% | 6.2%(-3.81)#57 | 6.4%(-3.91)#18,703 |
| 58. | Odessa | 2.3% | 6.2%(-3.96)#58 | 6.4%(-4.06)#18,933 |
| 59. | Dover Base Housing | 2.1% | 6.2%(-4.13)#59 | 6.4%(-4.24)#19,165 |
| 60. | Ardentown | 2.0% | 6.2%(-4.26)#60 | 6.4%(-4.37)#19,324 |
| 61. | Harrington | 2.0% | 6.2%(-4.30)#61 | 6.4%(-4.40)#19,356 |
| 62. | Bethel | 1.9% | 6.2%(-4.33)#62 | 6.4%(-4.43)#19,396 |
| 63. | Felton | 1.7% | 6.2%(-4.51)#63 | 6.4%(-4.61)#19,609 |
| 64. | Clayton | 0.75% | 6.2%(-5.50)#64 | 6.4%(-5.60)#20,432 |
1
Common Questions
What are the Top 10 Cities with the Highest Percentage of Population with a Degree in Bio, Nature & Agricultural in Delaware?
Top 10 Cities with the Highest Percentage of Population with a Degree in Bio, Nature & Agricultural in Delaware are:
#1
15.4%
#2
15.2%
#3
14.7%
#4
14.3%
#5
12.7%
#6
9.6%
#7
9.3%
#8
9.3%
#9
9.2%
#10
9.0%
What city has the Highest Percentage of Population with a Degree in Bio, Nature & Agricultural in Delaware?
Lewes has the Highest Percentage of Population with a Degree in Bio, Nature & Agricultural in Delaware with 15.4%.
What is the Percentage of Population with a Degree in Bio, Nature & Agricultural in the State of Delaware?
Percentage of Population with a Degree in Bio, Nature & Agricultural in Delaware is 6.2%.
What is the Percentage of Population with a Degree in Bio, Nature & Agricultural in the United States?
Percentage of Population with a Degree in Bio, Nature & Agricultural in the United States is 6.4%.