Cities with the Highest Percentage of Population with a Degree in Bio, Nature & Agricultural in Massachusetts
RELATED REPORTS & OPTIONS
Bio, Nature & Agricultural
Massachusetts
Compare Cities
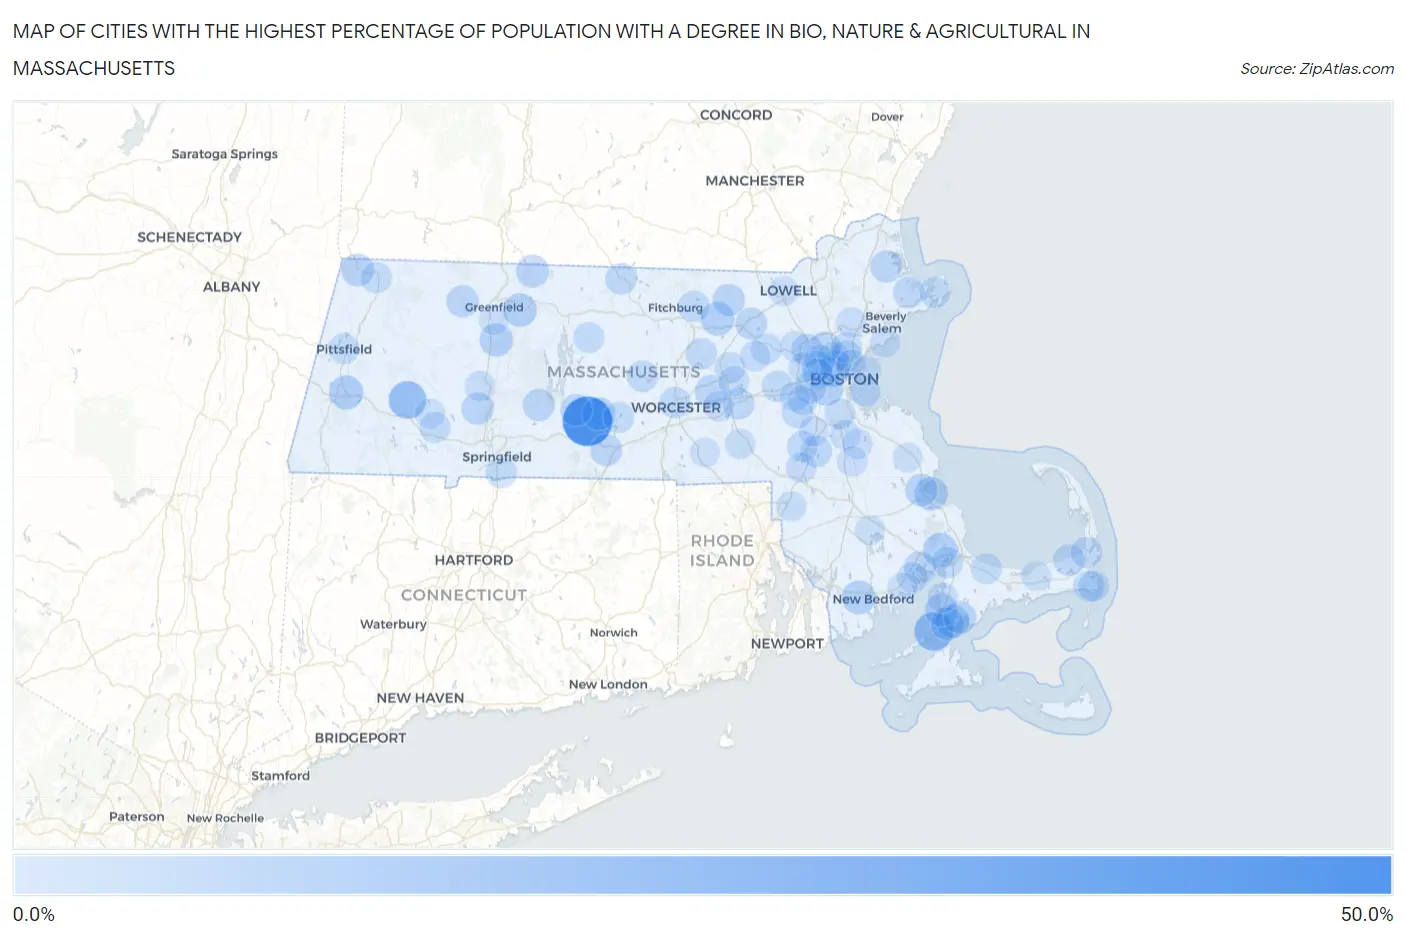
Map of Cities with the Highest Percentage of Population with a Degree in Bio, Nature & Agricultural in Massachusetts
0.0%
50.0%
Cities with the Highest Percentage of Population with a Degree in Bio, Nature & Agricultural in Massachusetts
| City | % Graduates | vs State | vs National | |
| 1. | Warren | 47.9% | 6.9%(+41.0)#1 | 6.4%(+41.5)#396 |
| 2. | Woods Hole | 24.2% | 6.9%(+17.3)#2 | 6.4%(+17.9)#1,492 |
| 3. | Chester | 22.1% | 6.9%(+15.1)#3 | 6.4%(+15.7)#1,745 |
| 4. | White Island Shores | 14.3% | 6.9%(+7.42)#4 | 6.4%(+7.98)#3,462 |
| 5. | Lee | 14.2% | 6.9%(+7.25)#5 | 6.4%(+7.81)#3,596 |
| 6. | Brookline | 13.6% | 6.9%(+6.64)#6 | 6.4%(+7.20)#3,828 |
| 7. | Devens | 13.4% | 6.9%(+6.50)#7 | 6.4%(+7.06)#3,887 |
| 8. | Smith Mills | 13.3% | 6.9%(+6.43)#8 | 6.4%(+6.99)#3,906 |
| 9. | North Plymouth | 13.1% | 6.9%(+6.16)#9 | 6.4%(+6.72)#4,037 |
| 10. | Millers Falls | 13.0% | 6.9%(+6.13)#10 | 6.4%(+6.69)#4,047 |
| 11. | South Deerfield | 13.0% | 6.9%(+6.04)#11 | 6.4%(+6.60)#4,097 |
| 12. | Teaticket | 12.9% | 6.9%(+5.99)#12 | 6.4%(+6.54)#4,136 |
| 13. | West Brookfield | 12.1% | 6.9%(+5.15)#13 | 6.4%(+5.71)#4,583 |
| 14. | West Falmouth | 12.0% | 6.9%(+5.09)#14 | 6.4%(+5.65)#4,606 |
| 15. | Falmouth | 12.0% | 6.9%(+5.09)#15 | 6.4%(+5.65)#4,607 |
| 16. | Northfield | 11.6% | 6.9%(+4.73)#16 | 6.4%(+5.29)#4,815 |
| 17. | Williamstown | 11.6% | 6.9%(+4.68)#17 | 6.4%(+5.24)#4,848 |
| 18. | East Falmouth | 11.1% | 6.9%(+4.23)#18 | 6.4%(+4.79)#5,094 |
| 19. | Groton | 10.9% | 6.9%(+3.98)#19 | 6.4%(+4.54)#5,301 |
| 20. | Northborough | 10.8% | 6.9%(+3.89)#20 | 6.4%(+4.45)#5,376 |
| 21. | Kingston | 10.7% | 6.9%(+3.82)#21 | 6.4%(+4.37)#5,420 |
| 22. | Easthampton Town | 10.5% | 6.9%(+3.61)#22 | 6.4%(+4.17)#5,606 |
| 23. | Ware | 10.5% | 6.9%(+3.58)#23 | 6.4%(+4.13)#5,622 |
| 24. | Shelburne Falls | 10.5% | 6.9%(+3.57)#24 | 6.4%(+4.13)#5,623 |
| 25. | Weweantic | 10.4% | 6.9%(+3.52)#25 | 6.4%(+4.08)#5,665 |
| 26. | Belchertown | 10.3% | 6.9%(+3.44)#26 | 6.4%(+4.00)#5,708 |
| 27. | Rowley | 10.3% | 6.9%(+3.41)#27 | 6.4%(+3.97)#5,738 |
| 28. | Cambridge | 10.2% | 6.9%(+3.25)#28 | 6.4%(+3.81)#5,857 |
| 29. | Somerville | 10.1% | 6.9%(+3.16)#29 | 6.4%(+3.72)#5,913 |
| 30. | Winchester | 10.0% | 6.9%(+3.10)#30 | 6.4%(+3.66)#5,946 |
| 31. | Lexington | 10.0% | 6.9%(+3.08)#31 | 6.4%(+3.64)#6,024 |
| 32. | Fiskdale | 9.9% | 6.9%(+2.98)#32 | 6.4%(+3.54)#6,076 |
| 33. | Amherst | 9.9% | 6.9%(+2.95)#33 | 6.4%(+3.51)#6,104 |
| 34. | Littleton Common | 9.8% | 6.9%(+2.93)#34 | 6.4%(+3.49)#6,120 |
| 35. | Sharon | 9.6% | 6.9%(+2.73)#35 | 6.4%(+3.29)#6,295 |
| 36. | Newton | 9.6% | 6.9%(+2.71)#36 | 6.4%(+3.27)#6,314 |
| 37. | Essex | 9.5% | 6.9%(+2.58)#37 | 6.4%(+3.14)#6,449 |
| 38. | Brewster | 9.3% | 6.9%(+2.39)#38 | 6.4%(+2.95)#6,644 |
| 39. | Cordaville | 9.3% | 6.9%(+2.34)#39 | 6.4%(+2.90)#6,694 |
| 40. | Winchendon | 9.3% | 6.9%(+2.34)#40 | 6.4%(+2.90)#6,696 |
| 41. | Malden | 9.1% | 6.9%(+2.21)#41 | 6.4%(+2.77)#6,791 |
| 42. | South Lancaster | 9.1% | 6.9%(+2.14)#42 | 6.4%(+2.70)#6,907 |
| 43. | Medford | 8.9% | 6.9%(+2.01)#43 | 6.4%(+2.57)#7,045 |
| 44. | Buzzards Bay | 8.9% | 6.9%(+2.00)#44 | 6.4%(+2.56)#7,051 |
| 45. | Worcester | 8.9% | 6.9%(+1.99)#45 | 6.4%(+2.55)#7,060 |
| 46. | Cochituate | 8.9% | 6.9%(+1.97)#46 | 6.4%(+2.52)#7,094 |
| 47. | Orleans | 8.8% | 6.9%(+1.88)#47 | 6.4%(+2.44)#7,187 |
| 48. | Rutland | 8.7% | 6.9%(+1.80)#48 | 6.4%(+2.36)#7,269 |
| 49. | Lunenburg | 8.7% | 6.9%(+1.78)#49 | 6.4%(+2.34)#7,331 |
| 50. | Boston | 8.7% | 6.9%(+1.76)#50 | 6.4%(+2.32)#7,344 |
| 51. | Longmeadow | 8.6% | 6.9%(+1.68)#51 | 6.4%(+2.24)#7,439 |
| 52. | Dover | 8.5% | 6.9%(+1.63)#52 | 6.4%(+2.19)#7,501 |
| 53. | Belmont | 8.4% | 6.9%(+1.51)#53 | 6.4%(+2.07)#7,627 |
| 54. | East Sandwich | 8.4% | 6.9%(+1.46)#54 | 6.4%(+2.02)#7,676 |
| 55. | North Adams | 8.2% | 6.9%(+1.33)#55 | 6.4%(+1.89)#7,888 |
| 56. | West Chatham | 8.2% | 6.9%(+1.31)#56 | 6.4%(+1.87)#7,909 |
| 57. | West Concord | 8.2% | 6.9%(+1.25)#57 | 6.4%(+1.81)#7,992 |
| 58. | Russell | 8.1% | 6.9%(+1.22)#58 | 6.4%(+1.78)#8,021 |
| 59. | Gloucester | 8.1% | 6.9%(+1.15)#59 | 6.4%(+1.71)#8,103 |
| 60. | Arlington | 8.0% | 6.9%(+1.14)#60 | 6.4%(+1.69)#8,128 |
| 61. | Hudson | 8.0% | 6.9%(+1.05)#61 | 6.4%(+1.61)#8,262 |
| 62. | Petersham | 7.9% | 6.9%(+1.01)#62 | 6.4%(+1.57)#8,312 |
| 63. | Walpole | 7.8% | 6.9%(+0.908)#63 | 6.4%(+1.47)#8,460 |
| 64. | Chatham | 7.8% | 6.9%(+0.903)#64 | 6.4%(+1.46)#8,465 |
| 65. | Pittsfield | 7.8% | 6.9%(+0.847)#65 | 6.4%(+1.41)#8,554 |
| 66. | East Brookfield | 7.7% | 6.9%(+0.805)#66 | 6.4%(+1.36)#8,618 |
| 67. | Greenfield | 7.7% | 6.9%(+0.771)#67 | 6.4%(+1.33)#8,730 |
| 68. | Milton | 7.5% | 6.9%(+0.592)#68 | 6.4%(+1.15)#8,970 |
| 69. | Melrose | 7.5% | 6.9%(+0.583)#69 | 6.4%(+1.14)#8,985 |
| 70. | Marion Center | 7.3% | 6.9%(+0.410)#70 | 6.4%(+0.969)#9,242 |
| 71. | Maynard | 7.2% | 6.9%(+0.336)#71 | 6.4%(+0.895)#9,340 |
| 72. | Milford | 7.2% | 6.9%(+0.310)#72 | 6.4%(+0.869)#9,369 |
| 73. | Watertown Town | 7.2% | 6.9%(+0.280)#73 | 6.4%(+0.839)#9,417 |
| 74. | Wellesley | 7.2% | 6.9%(+0.259)#74 | 6.4%(+0.819)#9,451 |
| 75. | Marlborough | 7.2% | 6.9%(+0.253)#75 | 6.4%(+0.812)#9,459 |
| 76. | Westborough | 7.1% | 6.9%(+0.207)#76 | 6.4%(+0.766)#9,572 |
| 77. | Hanscom Afb | 7.0% | 6.9%(+0.125)#77 | 6.4%(+0.685)#9,666 |
| 78. | Foxborough | 7.0% | 6.9%(+0.103)#78 | 6.4%(+0.663)#9,716 |
| 79. | Waltham | 7.0% | 6.9%(+0.103)#79 | 6.4%(+0.662)#9,718 |
| 80. | Northampton | 7.0% | 6.9%(+0.079)#80 | 6.4%(+0.638)#9,748 |
| 81. | North Falmouth | 7.0% | 6.9%(+0.066)#81 | 6.4%(+0.625)#9,763 |
| 82. | Chelsea | 6.9% | 6.9%(+0.036)#82 | 6.4%(+0.595)#9,825 |
| 83. | Randolph Town | 6.9% | 6.9%(-0.004)#83 | 6.4%(+0.556)#9,868 |
| 84. | Holbrook | 6.9% | 6.9%(-0.055)#84 | 6.4%(+0.505)#9,965 |
| 85. | Cedar Crest | 6.8% | 6.9%(-0.109)#85 | 6.4%(+0.450)#10,085 |
| 86. | Norwood | 6.8% | 6.9%(-0.125)#86 | 6.4%(+0.434)#10,106 |
| 87. | Brockton | 6.7% | 6.9%(-0.228)#87 | 6.4%(+0.331)#10,243 |
| 88. | Lynnfield | 6.7% | 6.9%(-0.237)#88 | 6.4%(+0.323)#10,252 |
| 89. | Needham | 6.4% | 6.9%(-0.519)#89 | 6.4%(+0.040)#10,755 |
| 90. | Attleboro | 6.3% | 6.9%(-0.574)#90 | 6.4%(-0.015)#10,864 |
| 91. | Swampscott | 6.3% | 6.9%(-0.624)#91 | 6.4%(-0.065)#10,956 |
| 92. | Huntington | 6.3% | 6.9%(-0.635)#92 | 6.4%(-0.075)#10,972 |
| 93. | Lowell | 6.2% | 6.9%(-0.741)#93 | 6.4%(-0.182)#11,207 |
| 94. | Mattapoisett Center | 6.1% | 6.9%(-0.763)#94 | 6.4%(-0.204)#11,252 |
| 95. | Yarmouth Port | 6.1% | 6.9%(-0.779)#95 | 6.4%(-0.220)#11,281 |
| 96. | Winthrop Town | 6.1% | 6.9%(-0.811)#96 | 6.4%(-0.252)#11,352 |
| 97. | North Lakeville | 6.1% | 6.9%(-0.813)#97 | 6.4%(-0.253)#11,358 |
| 98. | Deerfield | 6.1% | 6.9%(-0.829)#98 | 6.4%(-0.270)#11,389 |
| 99. | North Pembroke | 6.0% | 6.9%(-0.910)#99 | 6.4%(-0.351)#11,554 |
| 100. | Whitinsville | 6.0% | 6.9%(-0.961)#100 | 6.4%(-0.402)#11,663 |
Common Questions
What are the Top 10 Cities with the Highest Percentage of Population with a Degree in Bio, Nature & Agricultural in Massachusetts?
Top 10 Cities with the Highest Percentage of Population with a Degree in Bio, Nature & Agricultural in Massachusetts are:
#1
47.9%
#2
24.2%
#3
22.1%
#4
14.3%
#5
14.2%
#6
13.6%
#7
13.4%
#8
13.3%
#9
13.1%
#10
13.0%
What city has the Highest Percentage of Population with a Degree in Bio, Nature & Agricultural in Massachusetts?
Warren has the Highest Percentage of Population with a Degree in Bio, Nature & Agricultural in Massachusetts with 47.9%.
What is the Percentage of Population with a Degree in Bio, Nature & Agricultural in the State of Massachusetts?
Percentage of Population with a Degree in Bio, Nature & Agricultural in Massachusetts is 6.9%.
What is the Percentage of Population with a Degree in Bio, Nature & Agricultural in the United States?
Percentage of Population with a Degree in Bio, Nature & Agricultural in the United States is 6.4%.