Cities with the Most Immigrants from Russia in Massachusetts
RELATED REPORTS & OPTIONS
Russia
Massachusetts
Compare Cities
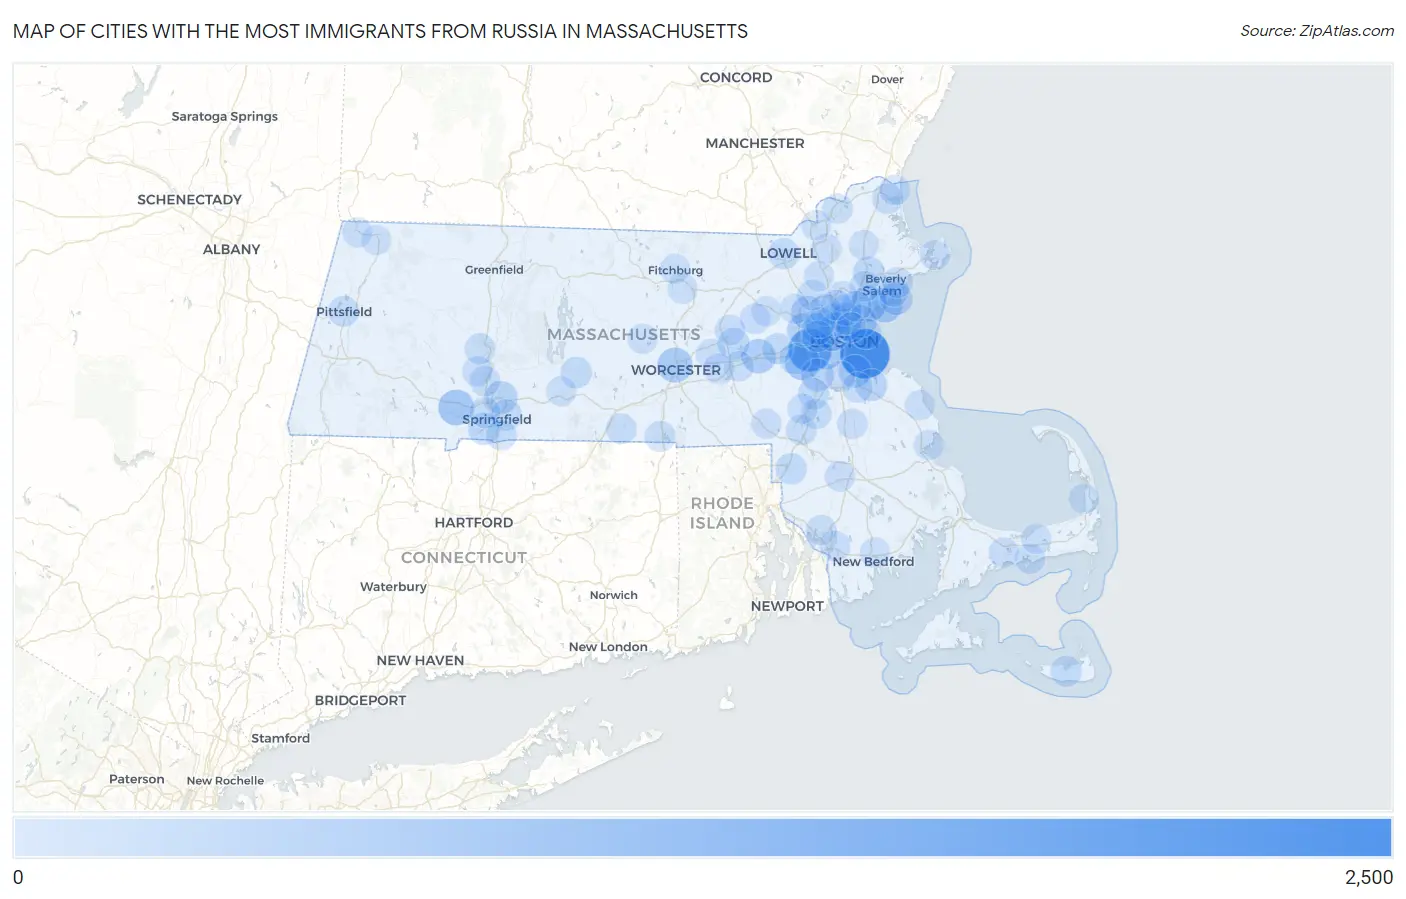
Map of Cities with the Most Immigrants from Russia in Massachusetts
0
2,500
Cities with the Most Immigrants from Russia in Massachusetts
| City | Russia | vs State | vs National | |
| 1. | Boston | 2,014 | 18,278(11.02%)#1 | 406,732(0.50%)#9 |
| 2. | Newton | 1,346 | 18,278(7.36%)#2 | 406,732(0.33%)#15 |
| 3. | Lynn | 578 | 18,278(3.16%)#3 | 406,732(0.14%)#68 |
| 4. | Brookline | 576 | 18,278(3.15%)#4 | 406,732(0.14%)#70 |
| 5. | Westfield | 557 | 18,278(3.05%)#5 | 406,732(0.14%)#76 |
| 6. | Needham | 532 | 18,278(2.91%)#6 | 406,732(0.13%)#82 |
| 7. | Worcester | 483 | 18,278(2.64%)#7 | 406,732(0.12%)#92 |
| 8. | Cambridge | 474 | 18,278(2.59%)#8 | 406,732(0.12%)#97 |
| 9. | Swampscott | 473 | 18,278(2.59%)#9 | 406,732(0.12%)#98 |
| 10. | Framingham | 394 | 18,278(2.16%)#10 | 406,732(0.10%)#125 |
| 11. | Revere | 309 | 18,278(1.69%)#11 | 406,732(0.08%)#166 |
| 12. | Waltham | 302 | 18,278(1.65%)#12 | 406,732(0.07%)#170 |
| 13. | Lexington | 301 | 18,278(1.65%)#13 | 406,732(0.07%)#171 |
| 14. | Dedham | 277 | 18,278(1.52%)#14 | 406,732(0.07%)#185 |
| 15. | Marblehead | 268 | 18,278(1.47%)#15 | 406,732(0.07%)#189 |
| 16. | Quincy | 258 | 18,278(1.41%)#16 | 406,732(0.06%)#197 |
| 17. | Medford | 257 | 18,278(1.41%)#17 | 406,732(0.06%)#199 |
| 18. | Chicopee | 252 | 18,278(1.38%)#18 | 406,732(0.06%)#203 |
| 19. | Weymouth Town | 185 | 18,278(1.01%)#19 | 406,732(0.05%)#309 |
| 20. | Somerville | 182 | 18,278(1.00%)#20 | 406,732(0.04%)#314 |
| 21. | Everett | 182 | 18,278(1.00%)#21 | 406,732(0.04%)#315 |
| 22. | Malden | 179 | 18,278(0.98%)#22 | 406,732(0.04%)#319 |
| 23. | Belmont | 179 | 18,278(0.98%)#23 | 406,732(0.04%)#320 |
| 24. | Agawam Town | 178 | 18,278(0.97%)#24 | 406,732(0.04%)#326 |
| 25. | Danvers | 177 | 18,278(0.97%)#25 | 406,732(0.04%)#328 |
| 26. | Marlborough | 168 | 18,278(0.92%)#26 | 406,732(0.04%)#346 |
| 27. | Melrose | 147 | 18,278(0.80%)#27 | 406,732(0.04%)#396 |
| 28. | Winchester | 144 | 18,278(0.79%)#28 | 406,732(0.04%)#401 |
| 29. | Ware | 141 | 18,278(0.77%)#29 | 406,732(0.03%)#409 |
| 30. | Norwood | 139 | 18,278(0.76%)#30 | 406,732(0.03%)#412 |
| 31. | Wellesley | 120 | 18,278(0.66%)#31 | 406,732(0.03%)#483 |
| 32. | Watertown Town | 118 | 18,278(0.65%)#32 | 406,732(0.03%)#493 |
| 33. | Attleboro | 113 | 18,278(0.62%)#33 | 406,732(0.03%)#513 |
| 34. | Springfield | 107 | 18,278(0.59%)#34 | 406,732(0.03%)#542 |
| 35. | Lowell | 105 | 18,278(0.57%)#35 | 406,732(0.03%)#551 |
| 36. | Nantucket | 105 | 18,278(0.57%)#36 | 406,732(0.03%)#555 |
| 37. | Arlington | 99 | 18,278(0.54%)#37 | 406,732(0.02%)#591 |
| 38. | West Springfield Town | 87 | 18,278(0.48%)#38 | 406,732(0.02%)#661 |
| 39. | Cochituate | 86 | 18,278(0.47%)#39 | 406,732(0.02%)#670 |
| 40. | Beverly | 80 | 18,278(0.44%)#40 | 406,732(0.02%)#717 |
| 41. | Pittsfield | 78 | 18,278(0.43%)#41 | 406,732(0.02%)#732 |
| 42. | Webster | 74 | 18,278(0.40%)#42 | 406,732(0.02%)#767 |
| 43. | Peabody | 69 | 18,278(0.38%)#43 | 406,732(0.02%)#811 |
| 44. | Sharon | 68 | 18,278(0.37%)#44 | 406,732(0.02%)#832 |
| 45. | Saugus | 67 | 18,278(0.37%)#45 | 406,732(0.02%)#846 |
| 46. | Northampton | 65 | 18,278(0.36%)#46 | 406,732(0.02%)#872 |
| 47. | Newburyport | 61 | 18,278(0.33%)#47 | 406,732(0.01%)#920 |
| 48. | Burlington | 60 | 18,278(0.33%)#48 | 406,732(0.01%)#932 |
| 49. | Longmeadow | 53 | 18,278(0.29%)#49 | 406,732(0.01%)#1,049 |
| 50. | Foxborough | 52 | 18,278(0.28%)#50 | 406,732(0.01%)#1,071 |
| 51. | Salem | 51 | 18,278(0.28%)#51 | 406,732(0.01%)#1,077 |
| 52. | Winthrop Town | 51 | 18,278(0.28%)#52 | 406,732(0.01%)#1,086 |
| 53. | Southbridge Town | 51 | 18,278(0.28%)#53 | 406,732(0.01%)#1,088 |
| 54. | Milton | 50 | 18,278(0.27%)#54 | 406,732(0.01%)#1,109 |
| 55. | Holyoke | 49 | 18,278(0.27%)#55 | 406,732(0.01%)#1,127 |
| 56. | Taunton | 43 | 18,278(0.24%)#56 | 406,732(0.01%)#1,246 |
| 57. | Braintree Town | 42 | 18,278(0.23%)#57 | 406,732(0.01%)#1,280 |
| 58. | Maynard | 41 | 18,278(0.22%)#58 | 406,732(0.01%)#1,323 |
| 59. | Fall River | 40 | 18,278(0.22%)#59 | 406,732(0.01%)#1,336 |
| 60. | Wakefield | 37 | 18,278(0.20%)#60 | 406,732(0.01%)#1,419 |
| 61. | Stoneham | 36 | 18,278(0.20%)#61 | 406,732(0.01%)#1,448 |
| 62. | Andover | 36 | 18,278(0.20%)#62 | 406,732(0.01%)#1,457 |
| 63. | Brockton | 35 | 18,278(0.19%)#63 | 406,732(0.01%)#1,467 |
| 64. | Westborough | 35 | 18,278(0.19%)#64 | 406,732(0.01%)#1,488 |
| 65. | Easthampton Town | 34 | 18,278(0.19%)#65 | 406,732(0.01%)#1,515 |
| 66. | Hudson | 34 | 18,278(0.19%)#66 | 406,732(0.01%)#1,516 |
| 67. | West Yarmouth | 32 | 18,278(0.18%)#67 | 406,732(0.01%)#1,593 |
| 68. | Franklin Town | 30 | 18,278(0.16%)#68 | 406,732(0.01%)#1,644 |
| 69. | Amherst | 27 | 18,278(0.15%)#69 | 406,732(0.01%)#1,746 |
| 70. | Somerset | 24 | 18,278(0.13%)#70 | 406,732(0.01%)#1,882 |
| 71. | Greenfield | 23 | 18,278(0.13%)#71 | 406,732(0.01%)#1,933 |
| 72. | Salisbury | 22 | 18,278(0.12%)#72 | 406,732(0.01%)#2,003 |
| 73. | Barnstable Town | 21 | 18,278(0.11%)#73 | 406,732(0.01%)#2,022 |
| 74. | Cordaville | 21 | 18,278(0.11%)#74 | 406,732(0.01%)#2,056 |
| 75. | Haverhill | 19 | 18,278(0.10%)#75 | 406,732(0.00%)#2,128 |
| 76. | Gloucester | 18 | 18,278(0.10%)#76 | 406,732(0.00%)#2,183 |
| 77. | Palmer Town | 15 | 18,278(0.08%)#77 | 406,732(0.00%)#2,390 |
| 78. | Walpole | 15 | 18,278(0.08%)#78 | 406,732(0.00%)#2,404 |
| 79. | South Duxbury | 15 | 18,278(0.08%)#79 | 406,732(0.00%)#2,412 |
| 80. | Northborough | 14 | 18,278(0.08%)#80 | 406,732(0.00%)#2,474 |
| 81. | West Concord | 14 | 18,278(0.08%)#81 | 406,732(0.00%)#2,476 |
| 82. | North Eastham | 14 | 18,278(0.08%)#82 | 406,732(0.00%)#2,499 |
| 83. | Methuen Town | 13 | 18,278(0.07%)#83 | 406,732(0.00%)#2,513 |
| 84. | Boxford | 13 | 18,278(0.07%)#84 | 406,732(0.00%)#2,579 |
| 85. | Marshfield Hills | 13 | 18,278(0.07%)#85 | 406,732(0.00%)#2,581 |
| 86. | Yarmouth Port | 11 | 18,278(0.06%)#86 | 406,732(0.00%)#2,750 |
| 87. | Wilmington | 9 | 18,278(0.05%)#87 | 406,732(0.00%)#2,917 |
| 88. | Rutland | 9 | 18,278(0.05%)#88 | 406,732(0.00%)#2,986 |
| 89. | Leominster | 8 | 18,278(0.04%)#89 | 406,732(0.00%)#3,004 |
| 90. | North Adams | 8 | 18,278(0.04%)#90 | 406,732(0.00%)#3,026 |
| 91. | Fitchburg | 7 | 18,278(0.04%)#91 | 406,732(0.00%)#3,109 |
| 92. | Williamstown | 5 | 18,278(0.03%)#92 | 406,732(0.00%)#3,321 |
| 93. | Hanscom Afb | 4 | 18,278(0.02%)#93 | 406,732(0.00%)#3,428 |
| 94. | New Bedford | 2 | 18,278(0.01%)#94 | 406,732(0.00%)#3,581 |
| 95. | Chelsea | 2 | 18,278(0.01%)#95 | 406,732(0.00%)#3,584 |
Common Questions
What are the Top 10 Cities with the Most Immigrants from Russia in Massachusetts?
Top 10 Cities with the Most Immigrants from Russia in Massachusetts are:
#1
2,014
#2
1,346
#3
578
#4
576
#5
557
#6
532
#7
483
#8
474
#9
473
#10
394
What city has the Most Immigrants from Russia in Massachusetts?
Boston has the Most Immigrants from Russia in Massachusetts with 2,014.
What is the Total Immigrants from Russia in the State of Massachusetts?
Total Immigrants from Russia in Massachusetts is 18,278.
What is the Total Immigrants from Russia in the United States?
Total Immigrants from Russia in the United States is 406,732.