Cities with the Highest Percentage of Thai Population in Illinois
RELATED REPORTS & OPTIONS
Thai
Illinois
Compare Cities
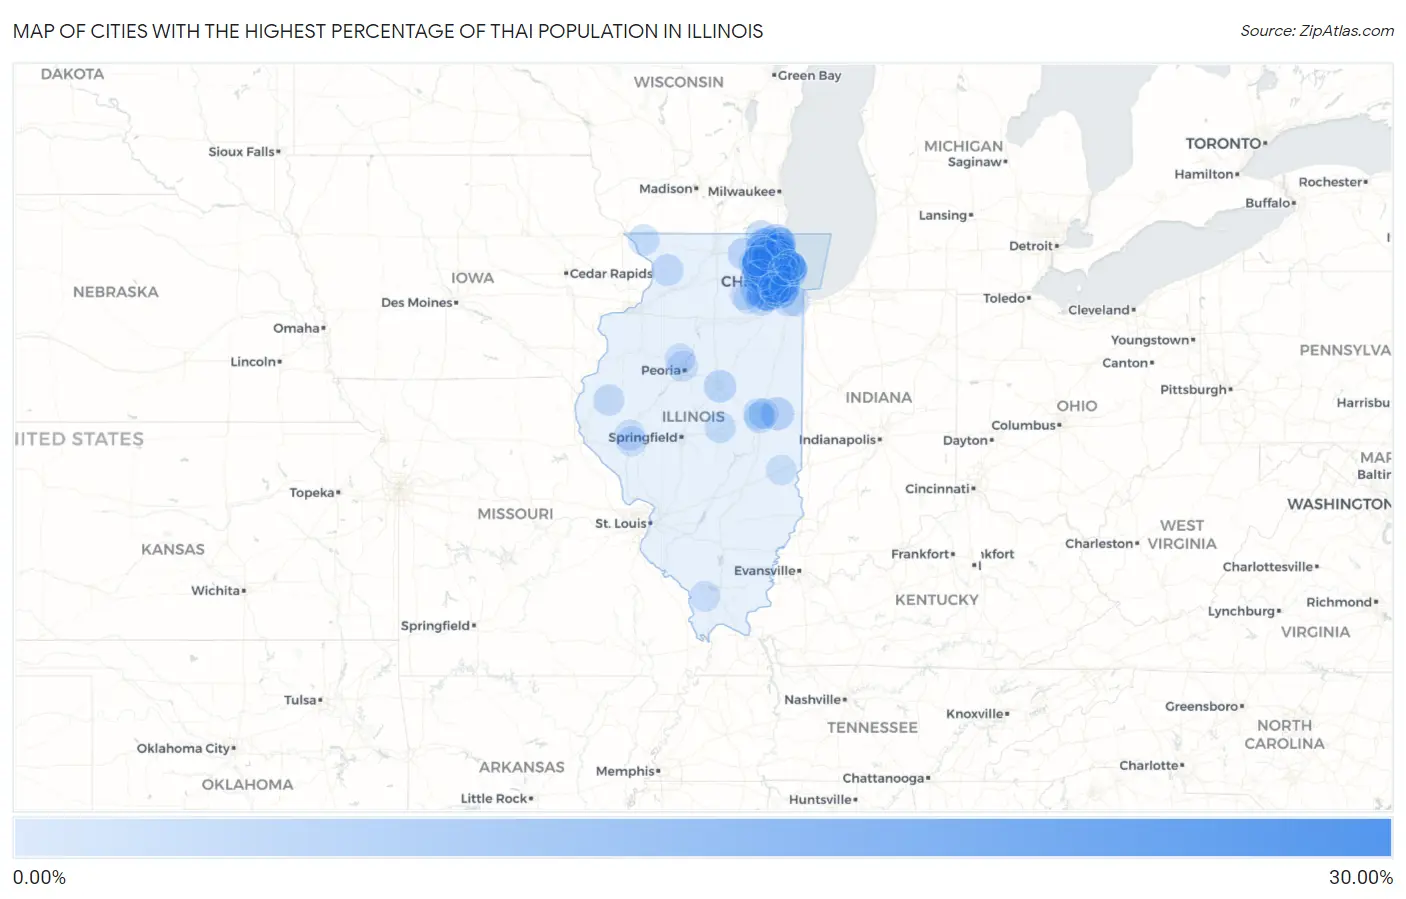
Map of Cities with the Highest Percentage of Thai Population in Illinois
0.00%
30.00%
Cities with the Highest Percentage of Thai Population in Illinois
| City | Thai | vs State | vs National | |
| 1. | South Barrington | 28.35% | 2.15%(+26.2)#1 | 1.44%(+26.9)#37 |
| 2. | Oak Brook | 15.36% | 2.15%(+13.2)#2 | 1.44%(+13.9)#109 |
| 3. | Buffalo Grove | 14.61% | 2.15%(+12.5)#3 | 1.44%(+13.2)#119 |
| 4. | Schaumburg | 13.65% | 2.15%(+11.5)#4 | 1.44%(+12.2)#133 |
| 5. | Naperville | 13.05% | 2.15%(+10.9)#5 | 1.44%(+11.6)#149 |
| 6. | Morton Grove | 12.32% | 2.15%(+10.2)#6 | 1.44%(+10.9)#162 |
| 7. | Vernon Hills | 12.26% | 2.15%(+10.1)#7 | 1.44%(+10.8)#163 |
| 8. | Indian Creek | 12.05% | 2.15%(+9.90)#8 | 1.44%(+10.6)#170 |
| 9. | Hoffman Estates | 12.03% | 2.15%(+9.88)#9 | 1.44%(+10.6)#171 |
| 10. | Burr Ridge | 10.82% | 2.15%(+8.67)#10 | 1.44%(+9.38)#203 |
| 11. | Hanover Park | 10.70% | 2.15%(+8.55)#11 | 1.44%(+9.27)#205 |
| 12. | Carol Stream | 10.64% | 2.15%(+8.49)#12 | 1.44%(+9.20)#208 |
| 13. | Kildeer | 10.33% | 2.15%(+8.18)#13 | 1.44%(+8.89)#218 |
| 14. | Lisle | 10.18% | 2.15%(+8.03)#14 | 1.44%(+8.75)#221 |
| 15. | Clarendon Hills | 8.97% | 2.15%(+6.82)#15 | 1.44%(+7.54)#266 |
| 16. | Hawthorn Woods | 8.48% | 2.15%(+6.33)#16 | 1.44%(+7.05)#291 |
| 17. | Lincolnwood | 8.32% | 2.15%(+6.17)#17 | 1.44%(+6.88)#300 |
| 18. | Bartlett | 8.28% | 2.15%(+6.12)#18 | 1.44%(+6.84)#302 |
| 19. | Round Lake | 8.25% | 2.15%(+6.09)#19 | 1.44%(+6.81)#307 |
| 20. | Inverness | 8.17% | 2.15%(+6.02)#20 | 1.44%(+6.73)#313 |
| 21. | Skokie | 7.93% | 2.15%(+5.77)#21 | 1.44%(+6.49)#325 |
| 22. | Wheeling | 7.84% | 2.15%(+5.69)#22 | 1.44%(+6.40)#330 |
| 23. | Des Plaines | 7.51% | 2.15%(+5.36)#23 | 1.44%(+6.07)#354 |
| 24. | Westmont | 7.42% | 2.15%(+5.27)#24 | 1.44%(+5.98)#359 |
| 25. | Grandwood Park | 7.18% | 2.15%(+5.03)#25 | 1.44%(+5.74)#377 |
| 26. | Oakbrook Terrace | 7.09% | 2.15%(+4.94)#26 | 1.44%(+5.65)#381 |
| 27. | Glendale Heights | 6.91% | 2.15%(+4.76)#27 | 1.44%(+5.48)#402 |
| 28. | Bloomingdale | 6.84% | 2.15%(+4.69)#28 | 1.44%(+5.40)#408 |
| 29. | Palatine | 6.62% | 2.15%(+4.47)#29 | 1.44%(+5.19)#422 |
| 30. | Itasca | 6.59% | 2.15%(+4.43)#30 | 1.44%(+5.15)#428 |
| 31. | Lombard | 6.50% | 2.15%(+4.35)#31 | 1.44%(+5.06)#436 |
| 32. | Gurnee | 6.29% | 2.15%(+4.14)#32 | 1.44%(+4.86)#451 |
| 33. | Streamwood | 6.28% | 2.15%(+4.13)#33 | 1.44%(+4.85)#454 |
| 34. | Mundelein | 6.25% | 2.15%(+4.10)#34 | 1.44%(+4.81)#457 |
| 35. | Niles | 6.18% | 2.15%(+4.02)#35 | 1.44%(+4.74)#464 |
| 36. | Lakemoor | 6.17% | 2.15%(+4.02)#36 | 1.44%(+4.73)#467 |
| 37. | Ogden | 6.08% | 2.15%(+3.93)#37 | 1.44%(+4.65)#477 |
| 38. | Aurora | 5.95% | 2.15%(+3.80)#38 | 1.44%(+4.51)#493 |
| 39. | Woodridge | 5.77% | 2.15%(+3.62)#39 | 1.44%(+4.34)#514 |
| 40. | Bolingbrook | 5.63% | 2.15%(+3.48)#40 | 1.44%(+4.20)#528 |
| 41. | Roselle | 5.35% | 2.15%(+3.20)#41 | 1.44%(+3.92)#564 |
| 42. | Bloomington | 5.31% | 2.15%(+3.16)#42 | 1.44%(+3.88)#567 |
| 43. | Lincolnshire | 5.17% | 2.15%(+3.02)#43 | 1.44%(+3.74)#585 |
| 44. | Glenview | 5.10% | 2.15%(+2.95)#44 | 1.44%(+3.67)#598 |
| 45. | Mount Prospect | 5.09% | 2.15%(+2.94)#45 | 1.44%(+3.66)#601 |
| 46. | Rolling Meadows | 5.00% | 2.15%(+2.85)#46 | 1.44%(+3.56)#613 |
| 47. | Spring Grove | 4.99% | 2.15%(+2.84)#47 | 1.44%(+3.55)#616 |
| 48. | Addison | 4.97% | 2.15%(+2.82)#48 | 1.44%(+3.53)#617 |
| 49. | Elmhurst | 4.93% | 2.15%(+2.78)#49 | 1.44%(+3.50)#625 |
| 50. | Arlington Heights | 4.86% | 2.15%(+2.71)#50 | 1.44%(+3.42)#636 |
| 51. | Northbrook | 4.80% | 2.15%(+2.65)#51 | 1.44%(+3.36)#643 |
| 52. | Union | 4.75% | 2.15%(+2.60)#52 | 1.44%(+3.32)#650 |
| 53. | Prospect Heights | 4.61% | 2.15%(+2.46)#53 | 1.44%(+3.17)#679 |
| 54. | Hinsdale | 4.60% | 2.15%(+2.45)#54 | 1.44%(+3.16)#680 |
| 55. | West Chicago | 4.56% | 2.15%(+2.41)#55 | 1.44%(+3.12)#691 |
| 56. | Green Oaks | 4.32% | 2.15%(+2.17)#56 | 1.44%(+2.88)#749 |
| 57. | Lake Zurich | 4.27% | 2.15%(+2.12)#57 | 1.44%(+2.83)#762 |
| 58. | Elk Grove Village | 4.26% | 2.15%(+2.11)#58 | 1.44%(+2.83)#765 |
| 59. | Chadwick | 4.17% | 2.15%(+2.02)#59 | 1.44%(+2.73)#789 |
| 60. | Plainfield | 4.04% | 2.15%(+1.89)#60 | 1.44%(+2.60)#829 |
| 61. | Glen Ellyn | 4.04% | 2.15%(+1.89)#61 | 1.44%(+2.60)#830 |
| 62. | Champaign | 3.96% | 2.15%(+1.81)#62 | 1.44%(+2.52)#852 |
| 63. | Wood Dale | 3.95% | 2.15%(+1.80)#63 | 1.44%(+2.51)#860 |
| 64. | South Elgin | 3.94% | 2.15%(+1.79)#64 | 1.44%(+2.50)#865 |
| 65. | Savoy | 3.90% | 2.15%(+1.75)#65 | 1.44%(+2.47)#875 |
| 66. | Plymouth | 3.89% | 2.15%(+1.73)#66 | 1.44%(+2.45)#884 |
| 67. | Forsyth | 3.71% | 2.15%(+1.56)#67 | 1.44%(+2.27)#933 |
| 68. | Barrington | 3.62% | 2.15%(+1.47)#68 | 1.44%(+2.18)#964 |
| 69. | Winfield | 3.62% | 2.15%(+1.47)#69 | 1.44%(+2.18)#965 |
| 70. | The Galena Territory | 3.49% | 2.15%(+1.34)#70 | 1.44%(+2.05)#996 |
| 71. | Forest Park | 3.35% | 2.15%(+1.20)#71 | 1.44%(+1.92)#1,044 |
| 72. | Gilberts | 3.29% | 2.15%(+1.14)#72 | 1.44%(+1.85)#1,067 |
| 73. | Peoria | 3.24% | 2.15%(+1.09)#73 | 1.44%(+1.81)#1,089 |
| 74. | Barrington Hills | 3.21% | 2.15%(+1.06)#74 | 1.44%(+1.78)#1,109 |
| 75. | Bonnie Brae | 3.08% | 2.15%(+0.933)#75 | 1.44%(+1.65)#1,168 |
| 76. | Long Grove | 3.06% | 2.15%(+0.905)#76 | 1.44%(+1.62)#1,184 |
| 77. | West Dundee | 2.97% | 2.15%(+0.819)#77 | 1.44%(+1.53)#1,224 |
| 78. | Prairie Grove | 2.95% | 2.15%(+0.798)#78 | 1.44%(+1.51)#1,240 |
| 79. | Meredosia | 2.94% | 2.15%(+0.787)#79 | 1.44%(+1.50)#1,247 |
| 80. | Urbana | 2.89% | 2.15%(+0.740)#80 | 1.44%(+1.45)#1,262 |
| 81. | Wayne | 2.88% | 2.15%(+0.725)#81 | 1.44%(+1.44)#1,267 |
| 82. | Dunlap | 2.82% | 2.15%(+0.672)#82 | 1.44%(+1.39)#1,298 |
| 83. | St Charles | 2.82% | 2.15%(+0.671)#83 | 1.44%(+1.38)#1,299 |
| 84. | North Barrington | 2.82% | 2.15%(+0.670)#84 | 1.44%(+1.38)#1,300 |
| 85. | Makanda | 2.80% | 2.15%(+0.649)#85 | 1.44%(+1.36)#1,306 |
| 86. | Yorkville | 2.79% | 2.15%(+0.641)#86 | 1.44%(+1.35)#1,310 |
| 87. | Waukegan | 2.71% | 2.15%(+0.557)#87 | 1.44%(+1.27)#1,359 |
| 88. | Port Barrington | 2.70% | 2.15%(+0.546)#88 | 1.44%(+1.26)#1,365 |
| 89. | Oak Forest | 2.58% | 2.15%(+0.426)#89 | 1.44%(+1.14)#1,433 |
| 90. | Bluffs | 2.56% | 2.15%(+0.406)#90 | 1.44%(+1.12)#1,444 |
| 91. | Darien | 2.52% | 2.15%(+0.368)#91 | 1.44%(+1.08)#1,460 |
| 92. | Summit | 2.49% | 2.15%(+0.341)#92 | 1.44%(+1.05)#1,470 |
| 93. | Downers Grove | 2.48% | 2.15%(+0.327)#93 | 1.44%(+1.04)#1,481 |
| 94. | Martinsville | 2.48% | 2.15%(+0.325)#94 | 1.44%(+1.04)#1,484 |
| 95. | Plano | 2.46% | 2.15%(+0.305)#95 | 1.44%(+1.02)#1,495 |
| 96. | Evanston | 2.34% | 2.15%(+0.188)#96 | 1.44%(+0.901)#1,571 |
| 97. | Carpentersville | 2.26% | 2.15%(+0.111)#97 | 1.44%(+0.825)#1,625 |
| 98. | Harvey | 2.25% | 2.15%(+0.095)#98 | 1.44%(+0.809)#1,636 |
| 99. | Park Ridge | 2.21% | 2.15%(+0.064)#99 | 1.44%(+0.778)#1,657 |
| 100. | Wilmette | 2.18% | 2.15%(+0.029)#100 | 1.44%(+0.742)#1,673 |
Common Questions
What are the Top 10 Cities with the Highest Percentage of Thai Population in Illinois?
Top 10 Cities with the Highest Percentage of Thai Population in Illinois are:
#1
28.35%
#2
15.36%
#3
14.61%
#4
13.65%
#5
13.05%
#6
12.32%
#7
12.26%
#8
12.05%
#9
12.03%
#10
10.82%
What city has the Highest Percentage of Thai Population in Illinois?
South Barrington has the Highest Percentage of Thai Population in Illinois with 28.35%.
What is the Percentage of Thai Population in the State of Illinois?
Percentage of Thai Population in Illinois is 2.15%.
What is the Percentage of Thai Population in the United States?
Percentage of Thai Population in the United States is 1.44%.