Cities with the Highest Percentage of Thai Population in Idaho

RELATED REPORTS & OPTIONS

Thai
Population
Families and Households
Female Fertility
Female Fertility (Unmarried)
Race (Community Size)
Race (Percentage)
Ancestry (Community Size)
AfghanAfricanAlaska NativeAlaskan AthabascanAlbanianAleutAlsatianAmericanApacheArabArapahoArgentineanArmenianAssyrian / Chaldean / SyriacAustralianAustrianBahamianBangladeshiBarbadianBasqueBelgianBelizeanBermudanBhutaneseBlackfeetBolivianBrazilianBritishBritish West IndianBulgarianBurmeseCajunCambodianCanadianCape VerdeanCarpatho RusynCelticCentral AmericanCentral American IndianCherokeeCheyenneChickasawChileanChineseChippewaChoctawColombianColvilleComancheCosta RicanCreeCreekCroatianCrowCubanCypriotCzechCzechoslovakianDanishDelawareDominicanDutchDutch West IndianEastern EuropeanEcuadorianEgyptianEnglishEstonianEthiopianEuropeanFijianFilipinoFinnishFrenchFrench American IndianFrench CanadianGermanGerman RussianGhanaianGreekGuamanian / ChamorroGuatemalanGuyaneseHaitianHmongHonduranHopiHoumaHungarianIcelanderIndian (Asian)IndonesianInupiatIranianIraqiIrishIroquoisIsraeliItalianJamaicanJapaneseJordanianKenyanKiowaKoreanLaotianLatvianLebaneseLiberianLithuanianLumbeeLuxembourgerMacedonianMalaysianMalteseMarshalleseMenomineeMexicanMexican American IndianMongolianMoroccanNative HawaiianNavajoNepaleseNew ZealanderNicaraguanNigerianNorthern EuropeanNorwegianOkinawanOsageOttawaPaiutePakistaniPalestinianPanamanianParaguayanPennsylvania GermanPeruvianPimaPolishPortuguesePotawatomiPuebloPuerto RicanPuget Sound SalishRomanianRussianSalvadoranSamoanScandinavianScotch-IrishScottishSeminoleSenegaleseSerbianShoshoneSierra LeoneanSiouxSlavicSlovakSloveneSomaliSouth AfricanSouth AmericanSouth American IndianSoviet UnionSpaniardSpanishSpanish AmericanSpanish American IndianSri LankanSubsaharan AfricanSudaneseSwedishSwissSyrianTaiwaneseThaiTlingit-HaidaTohono O'OdhamTonganTrinidadian and TobagonianTsimshianTurkishU.S. Virgin IslanderUgandanUkrainianUruguayanUteVenezuelanVietnameseWelshWest IndianYakamaYaquiYugoslavianYumanYup'ikZimbabwean
Ancestry (Percentage)
AfghanAfricanAlaska NativeAlaskan AthabascanAlbanianAleutAlsatianAmericanApacheArabArapahoArgentineanArmenianAssyrian / Chaldean / SyriacAustralianAustrianBahamianBangladeshiBarbadianBasqueBelgianBelizeanBermudanBhutaneseBlackfeetBolivianBrazilianBritishBritish West IndianBulgarianBurmeseCajunCambodianCanadianCape VerdeanCarpatho RusynCelticCentral AmericanCentral American IndianCherokeeCheyenneChickasawChileanChineseChippewaChoctawColombianColvilleComancheCosta RicanCreeCreekCroatianCrowCubanCypriotCzechCzechoslovakianDanishDelawareDominicanDutchDutch West IndianEastern EuropeanEcuadorianEgyptianEnglishEstonianEthiopianEuropeanFijianFilipinoFinnishFrenchFrench American IndianFrench CanadianGermanGerman RussianGhanaianGreekGuamanian / ChamorroGuatemalanGuyaneseHaitianHmongHonduranHopiHoumaHungarianIcelanderIndian (Asian)IndonesianInupiatIranianIraqiIrishIroquoisIsraeliItalianJamaicanJapaneseJordanianKenyanKiowaKoreanLaotianLatvianLebaneseLiberianLithuanianLumbeeLuxembourgerMacedonianMalaysianMalteseMarshalleseMenomineeMexicanMexican American IndianMongolianMoroccanNative HawaiianNavajoNepaleseNew ZealanderNicaraguanNigerianNorthern EuropeanNorwegianOkinawanOsageOttawaPaiutePakistaniPalestinianPanamanianParaguayanPennsylvania GermanPeruvianPimaPolishPortuguesePotawatomiPuebloPuerto RicanPuget Sound SalishRomanianRussianSalvadoranSamoanScandinavianScotch-IrishScottishSeminoleSenegaleseSerbianShoshoneSierra LeoneanSiouxSlavicSlovakSloveneSomaliSouth AfricanSouth AmericanSouth American IndianSoviet UnionSpaniardSpanishSpanish AmericanSpanish American IndianSri LankanSubsaharan AfricanSudaneseSwedishSwissSyrianTaiwaneseThaiTlingit-HaidaTohono O'OdhamTonganTrinidadian and TobagonianTsimshianTurkishU.S. Virgin IslanderUgandanUkrainianUruguayanUteVenezuelanVietnameseWelshWest IndianYakamaYaquiYugoslavianYumanYup'ikZimbabwean
Immigrant Origin (Total)
AfghanistanAfricaAlbaniaArgentinaArmeniaAsiaAustraliaAustriaAzoresBahamasBangladeshBarbadosBelarusBelgiumBelizeBoliviaBosnia and HerzegovinaBrazilBulgariaBurma / MyanmarCabo VerdeCambodiaCameroonCanadaCaribbeanCentral AmericaChileChinaColombiaCongoCosta RicaCroatiaCubaCzechoslovakiaDenmarkDominicaDominican RepublicEastern AfricaEastern AsiaEastern EuropeEcuadorEgyptEl SalvadorEnglandEritreaEthiopiaEuropeFijiFranceGermanyGhanaGreeceGrenadaGuatemalaGuyanaHaitiHondurasHong KongHungaryIndiaIndonesiaIranIraqIrelandIsraelItalyJamaicaJapanJordanKazakhstanKenyaKoreaKuwaitLaosLatin AmericaLatviaLebanonLiberiaLithuaniaMalaysiaMexicoMicronesiaMiddle AfricaMoldovaMoroccoNepalNetherlandsNicaraguaNigeriaNorth MacedoniaNorthern AfricaNorthern EuropeNorwayOceaniaPakistanPanamaPeruPhilippinesPolandPortugalRomaniaRussiaSaudi ArabiaScotlandSenegalSerbiaSierra LeoneSingaporeSomaliaSouth AfricaSouth AmericaSouth Central AsiaSouth Eastern AsiaSouthern EuropeSpainSri LankaSt. Vincent and the GrenadinesSudanSwedenSwitzerlandSyriaTaiwanThailandTrinidad and TobagoTurkeyUgandaUkraineUruguayUzbekistanVenezuelaVietnamWest IndiesWestern AfricaWestern AsiaWestern EuropeYemenZaireZimbabwe
Immigrant Origin (Percentage)
AfghanistanAfricaAlbaniaArgentinaArmeniaAsiaAustraliaAustriaAzoresBahamasBangladeshBarbadosBelarusBelgiumBelizeBoliviaBosnia and HerzegovinaBrazilBulgariaBurma / MyanmarCabo VerdeCambodiaCameroonCanadaCaribbeanCentral AmericaChileChinaColombiaCongoCosta RicaCroatiaCubaCzechoslovakiaDenmarkDominicaDominican RepublicEastern AfricaEastern AsiaEastern EuropeEcuadorEgyptEl SalvadorEnglandEritreaEthiopiaEuropeFijiFranceGermanyGhanaGreeceGrenadaGuatemalaGuyanaHaitiHondurasHong KongHungaryIndiaIndonesiaIranIraqIrelandIsraelItalyJamaicaJapanJordanKazakhstanKenyaKoreaKuwaitLaosLatin AmericaLatviaLebanonLiberiaLithuaniaMalaysiaMexicoMicronesiaMiddle AfricaMoldovaMoroccoNepalNetherlandsNicaraguaNigeriaNorth MacedoniaNorthern AfricaNorthern EuropeNorwayOceaniaPakistanPanamaPeruPhilippinesPolandPortugalRomaniaRussiaSaudi ArabiaScotlandSenegalSerbiaSierra LeoneSingaporeSomaliaSouth AfricaSouth AmericaSouth Central AsiaSouth Eastern AsiaSouthern EuropeSpainSri LankaSt. Vincent and the GrenadinesSudanSwedenSwitzerlandSyriaTaiwanThailandTrinidad and TobagoTurkeyUgandaUkraineUruguayUzbekistanVenezuelaVietnamWest IndiesWestern AfricaWestern AsiaWestern EuropeYemenZaireZimbabwe
Income
Income (Families)
Income (Households)
Poverty
Poverty (Families)
Unemployment
Employment Occupations
Employment Industries
Employer Class
Commute Time
Commute Means
School Enrollment
Education by Degree Field
Occupancy
Finances
Physical Characteristics
Idaho
Compare Cities
Comparison Subject

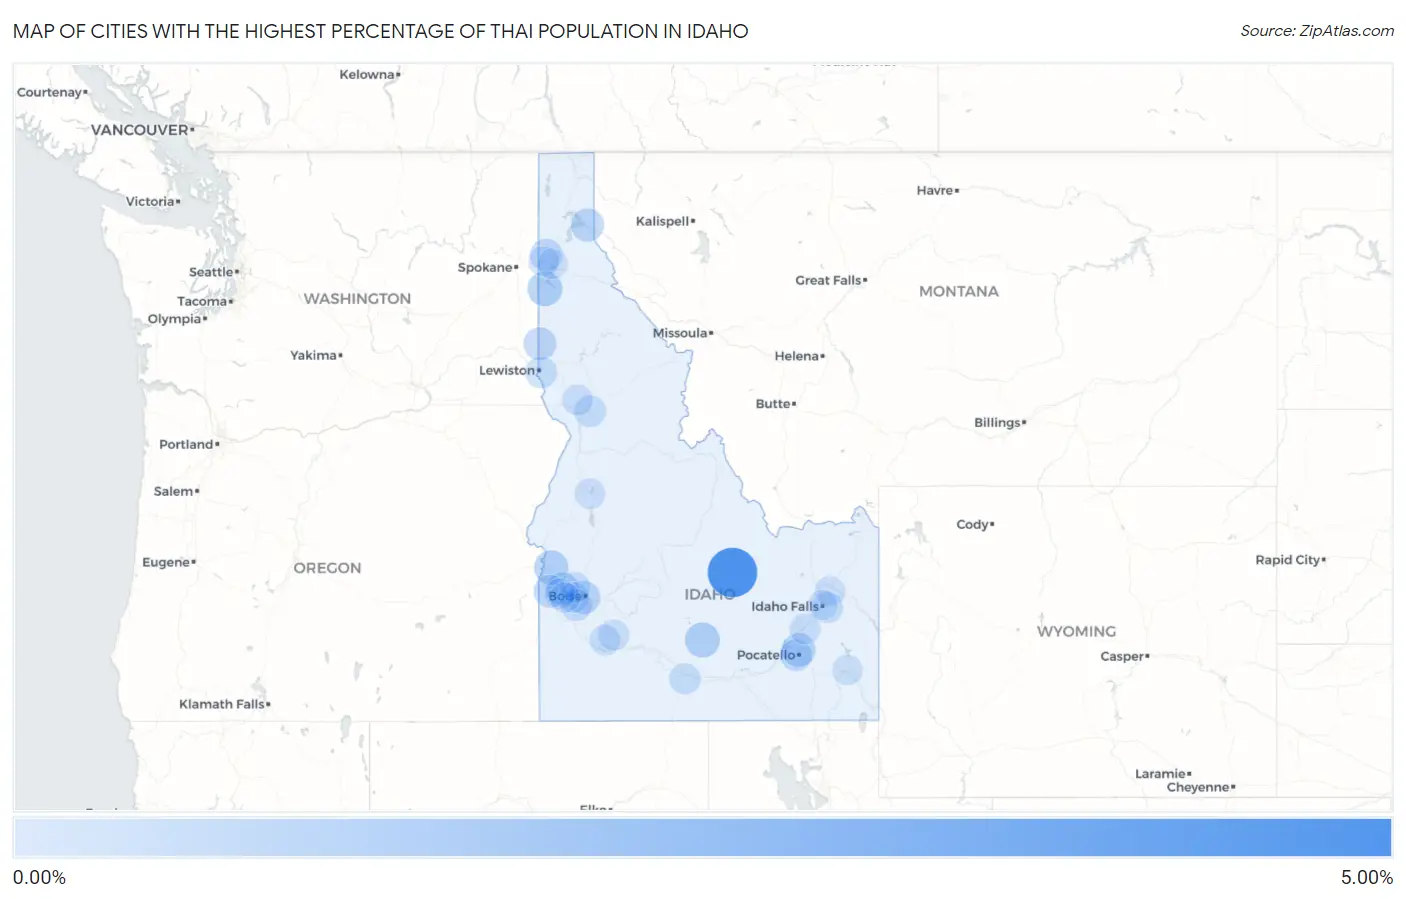
Map of Cities with the Highest Percentage of Thai Population in Idaho

0.00%
5.00%
Cities with the Highest Percentage of Thai Population in Idaho Map

Cities with the Highest Percentage of Thai Population in Idaho

City Thai vs State vs National
1.Mackay4.94%0.20%(+4.74)#11.44%(+3.50)#624
2.Richfield1.18%0.20%(+0.976)#21.44%(-0.259)#2,821
3.Worley1.16%0.20%(+0.960)#31.44%(-0.275)#2,845
4.New Plymouth0.97%0.20%(+0.770)#41.44%(-0.465)#3,233
5.Chubbuck0.86%0.20%(+0.660)#51.44%(-0.574)#3,460
6.Boise City0.76%0.20%(+0.556)#61.44%(-0.679)#3,733
7.Clark Fork0.73%0.20%(+0.524)#71.44%(-0.711)#3,827
8.Middleton0.68%0.20%(+0.473)#81.44%(-0.761)#3,976
9.Moscow0.64%0.20%(+0.441)#91.44%(-0.793)#4,084
10.Greenleaf0.60%0.20%(+0.400)#101.44%(-0.834)#4,223
11.Rathdrum0.58%0.20%(+0.373)#111.44%(-0.862)#4,333
12.Kuna0.45%0.20%(+0.244)#121.44%(-0.991)#4,787
13.Pocatello0.40%0.20%(+0.200)#131.44%(-1.03)#4,980
14.Grangeville0.39%0.20%(+0.183)#141.44%(-1.05)#5,072
15.Lewiston0.38%0.20%(+0.174)#151.44%(-1.06)#5,126
16.Twin Falls0.26%0.20%(+0.053)#161.44%(-1.18)#5,688
17.Ammon0.24%0.20%(+0.037)#171.44%(-1.20)#5,801
18.Mountain Home0.19%0.20%(-0.009)#181.44%(-1.24)#6,071
19.Mountain Home Afb0.19%0.20%(-0.014)#191.44%(-1.25)#6,099
20.Blackfoot0.19%0.20%(-0.017)#201.44%(-1.25)#6,115
21.Cottonwood0.16%0.20%(-0.042)#211.44%(-1.28)#6,271
22.Eagle0.16%0.20%(-0.043)#221.44%(-1.28)#6,278
23.Meridian0.13%0.20%(-0.075)#231.44%(-1.31)#6,482
24.Rigby0.12%0.20%(-0.085)#241.44%(-1.32)#6,539
25.Soda Springs0.096%0.20%(-0.107)#251.44%(-1.34)#6,671
26.Mccall0.080%0.20%(-0.122)#261.44%(-1.36)#6,765
27.Caldwell0.078%0.20%(-0.124)#271.44%(-1.36)#6,785
28.Post Falls0.067%0.20%(-0.135)#281.44%(-1.37)#6,854
29.Coeur D Alene0.060%0.20%(-0.142)#291.44%(-1.38)#6,894
30.Nampa0.047%0.20%(-0.156)#301.44%(-1.39)#6,981
31.Idaho Falls0.021%0.20%(-0.181)#311.44%(-1.42)#7,130

Common Questions

What are the Top 10 Cities with the Highest Percentage of Thai Population in Idaho?
Top 10 Cities with the Highest Percentage of Thai Population in Idaho are:
#1
4.94%
#2
1.18%
#3
1.16%
#4
0.97%
#5
0.86%
#6
0.76%
#7
0.73%
#8
0.68%
#9
0.64%
#10
0.60%
What city has the Highest Percentage of Thai Population in Idaho?
Mackay has the Highest Percentage of Thai Population in Idaho with 4.94%.
What is the Percentage of Thai Population in the State of Idaho?
Percentage of Thai Population in Idaho is 0.20%.
What is the Percentage of Thai Population in the United States?
Percentage of Thai Population in the United States is 1.44%.