Cities with the Highest Percentage of Thai Population in Iowa
RELATED REPORTS & OPTIONS
Thai
Iowa
Compare Cities
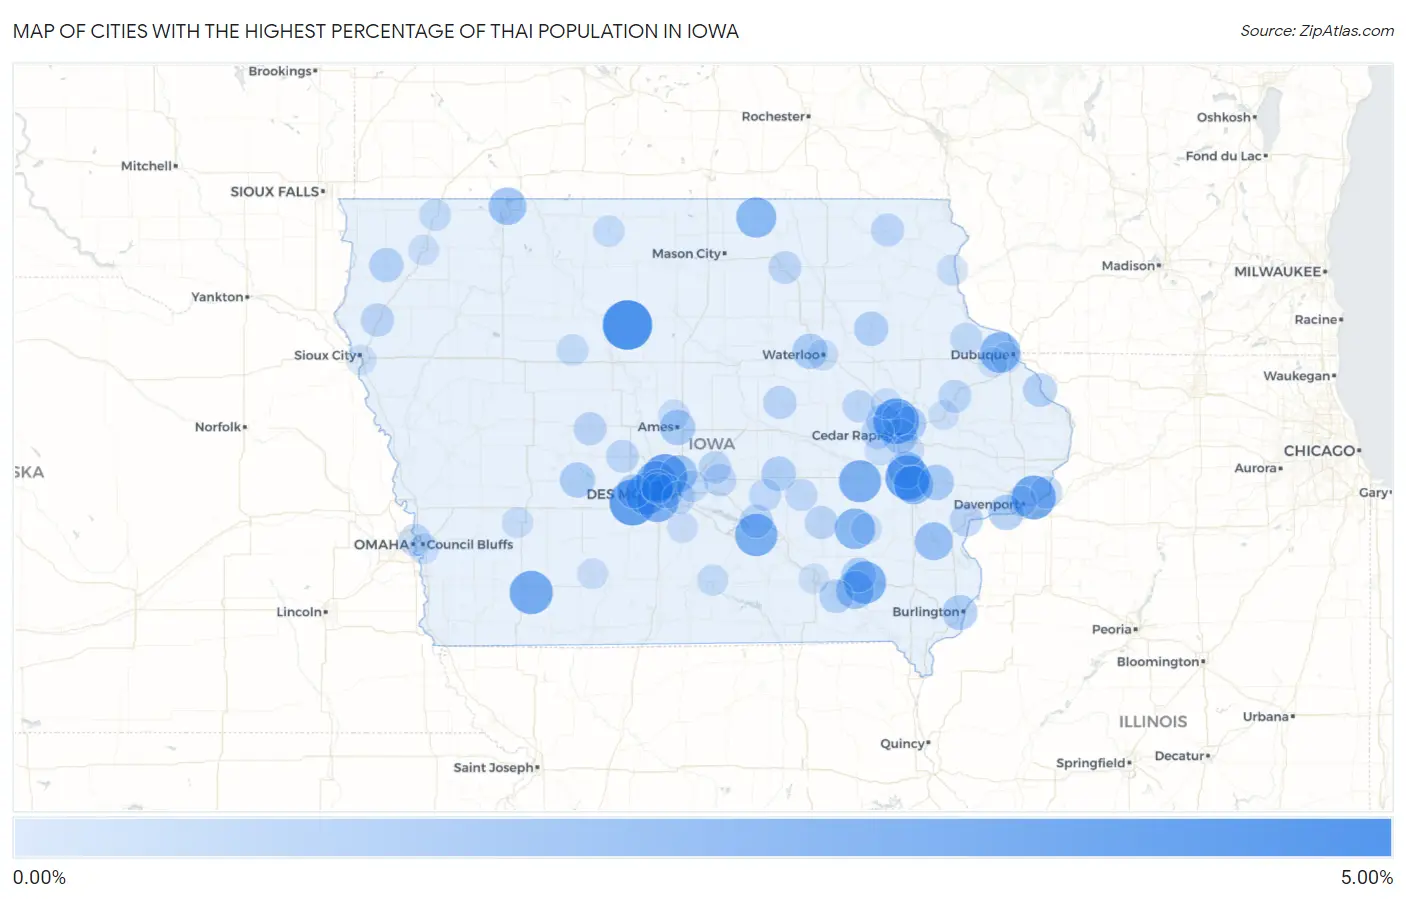
Map of Cities with the Highest Percentage of Thai Population in Iowa
0.00%
5.00%
Cities with the Highest Percentage of Thai Population in Iowa
| City | Thai | vs State | vs National | |
| 1. | Thor | 4.66% | 0.54%(+4.12)#1 | 1.44%(+3.23)#671 |
| 2. | De Soto | 3.78% | 0.54%(+3.24)#2 | 1.44%(+2.35)#916 |
| 3. | Hiawatha | 3.64% | 0.54%(+3.09)#3 | 1.44%(+2.20)#958 |
| 4. | Johnston | 3.41% | 0.54%(+2.87)#4 | 1.44%(+1.97)#1,027 |
| 5. | Coralville | 3.36% | 0.54%(+2.81)#5 | 1.44%(+1.92)#1,042 |
| 6. | Bettendorf | 3.31% | 0.54%(+2.77)#6 | 1.44%(+1.87)#1,057 |
| 7. | Nodaway | 3.12% | 0.54%(+2.58)#7 | 1.44%(+1.69)#1,150 |
| 8. | Harvey | 2.91% | 0.54%(+2.36)#8 | 1.44%(+1.47)#1,257 |
| 9. | Fairfield | 2.87% | 0.54%(+2.33)#9 | 1.44%(+1.43)#1,270 |
| 10. | Williamsburg | 2.85% | 0.54%(+2.31)#10 | 1.44%(+1.41)#1,281 |
| 11. | Waukee | 2.84% | 0.54%(+2.30)#11 | 1.44%(+1.41)#1,285 |
| 12. | West Des Moines | 2.79% | 0.54%(+2.24)#12 | 1.44%(+1.35)#1,313 |
| 13. | Grimes | 2.52% | 0.54%(+1.98)#13 | 1.44%(+1.08)#1,459 |
| 14. | Asbury | 2.48% | 0.54%(+1.94)#14 | 1.44%(+1.04)#1,480 |
| 15. | Harper | 2.42% | 0.54%(+1.88)#15 | 1.44%(+0.982)#1,514 |
| 16. | St Ansgar | 2.37% | 0.54%(+1.83)#16 | 1.44%(+0.931)#1,542 |
| 17. | Iowa City | 2.06% | 0.54%(+1.52)#17 | 1.44%(+0.621)#1,747 |
| 18. | Libertyville | 1.85% | 0.54%(+1.30)#18 | 1.44%(+0.409)#1,921 |
| 19. | Columbus Junction | 1.82% | 0.54%(+1.28)#19 | 1.44%(+0.386)#1,960 |
| 20. | Orleans | 1.74% | 0.54%(+1.20)#20 | 1.44%(+0.302)#2,055 |
| 21. | North Liberty | 1.61% | 0.54%(+1.07)#21 | 1.44%(+0.171)#2,184 |
| 22. | Ankeny | 1.59% | 0.54%(+1.04)#22 | 1.44%(+0.149)#2,215 |
| 23. | University Heights | 1.48% | 0.54%(+0.936)#23 | 1.44%(+0.041)#2,355 |
| 24. | West Branch | 1.24% | 0.54%(+0.696)#24 | 1.44%(-0.199)#2,717 |
| 25. | Ames | 1.23% | 0.54%(+0.687)#25 | 1.44%(-0.208)#2,728 |
| 26. | Buffalo | 1.21% | 0.54%(+0.664)#26 | 1.44%(-0.231)#2,764 |
| 27. | Cedar Falls | 1.18% | 0.54%(+0.642)#27 | 1.44%(-0.253)#2,804 |
| 28. | Guthrie Center | 1.18% | 0.54%(+0.641)#28 | 1.44%(-0.254)#2,807 |
| 29. | Marion | 1.12% | 0.54%(+0.581)#29 | 1.44%(-0.314)#2,915 |
| 30. | Burlington | 1.12% | 0.54%(+0.575)#30 | 1.44%(-0.320)#2,922 |
| 31. | Maharishi Vedic City | 1.09% | 0.54%(+0.548)#31 | 1.44%(-0.347)#2,981 |
| 32. | Cedar Rapids | 1.07% | 0.54%(+0.528)#32 | 1.44%(-0.367)#3,021 |
| 33. | Grinnell | 1.02% | 0.54%(+0.477)#33 | 1.44%(-0.418)#3,130 |
| 34. | Oelwein | 0.99% | 0.54%(+0.452)#34 | 1.44%(-0.443)#3,182 |
| 35. | Sioux Center | 0.95% | 0.54%(+0.406)#35 | 1.44%(-0.489)#3,287 |
| 36. | Palo | 0.95% | 0.54%(+0.404)#36 | 1.44%(-0.491)#3,291 |
| 37. | Windsor Heights | 0.94% | 0.54%(+0.400)#37 | 1.44%(-0.495)#3,294 |
| 38. | Adel | 0.94% | 0.54%(+0.393)#38 | 1.44%(-0.501)#3,304 |
| 39. | Bellevue | 0.89% | 0.54%(+0.349)#39 | 1.44%(-0.546)#3,400 |
| 40. | Eldon | 0.84% | 0.54%(+0.293)#40 | 1.44%(-0.602)#3,518 |
| 41. | Urbandale | 0.82% | 0.54%(+0.278)#41 | 1.44%(-0.617)#3,561 |
| 42. | Robins | 0.77% | 0.54%(+0.232)#42 | 1.44%(-0.663)#3,688 |
| 43. | Pella | 0.76% | 0.54%(+0.215)#43 | 1.44%(-0.680)#3,737 |
| 44. | Merrill | 0.73% | 0.54%(+0.187)#44 | 1.44%(-0.708)#3,817 |
| 45. | Muscatine | 0.73% | 0.54%(+0.184)#45 | 1.44%(-0.711)#3,828 |
| 46. | Gladbrook | 0.72% | 0.54%(+0.180)#46 | 1.44%(-0.715)#3,849 |
| 47. | What Cheer | 0.69% | 0.54%(+0.148)#47 | 1.44%(-0.747)#3,936 |
| 48. | Jefferson | 0.67% | 0.54%(+0.126)#48 | 1.44%(-0.769)#3,998 |
| 49. | Monticello | 0.64% | 0.54%(+0.102)#49 | 1.44%(-0.793)#4,081 |
| 50. | Decorah | 0.64% | 0.54%(+0.101)#50 | 1.44%(-0.794)#4,085 |
| 51. | Perry | 0.63% | 0.54%(+0.092)#51 | 1.44%(-0.803)#4,120 |
| 52. | Atkins | 0.61% | 0.54%(+0.067)#52 | 1.44%(-0.828)#4,209 |
| 53. | Charles City | 0.60% | 0.54%(+0.055)#53 | 1.44%(-0.840)#4,250 |
| 54. | Des Moines | 0.59% | 0.54%(+0.052)#54 | 1.44%(-0.843)#4,262 |
| 55. | Colfax | 0.59% | 0.54%(+0.052)#55 | 1.44%(-0.843)#4,263 |
| 56. | Mingo | 0.58% | 0.54%(+0.036)#56 | 1.44%(-0.859)#4,327 |
| 57. | Carter Lake | 0.56% | 0.54%(+0.013)#57 | 1.44%(-0.882)#4,391 |
| 58. | Vinton | 0.55% | 0.54%(+0.003)#58 | 1.44%(-0.892)#4,436 |
| 59. | Le Claire | 0.53% | 0.54%(-0.008)#59 | 1.44%(-0.903)#4,473 |
| 60. | Sully | 0.49% | 0.54%(-0.053)#60 | 1.44%(-0.948)#4,625 |
| 61. | Luxemburg | 0.45% | 0.54%(-0.092)#61 | 1.44%(-0.987)#4,777 |
| 62. | Montezuma | 0.45% | 0.54%(-0.093)#62 | 1.44%(-0.988)#4,781 |
| 63. | Sibley | 0.42% | 0.54%(-0.118)#63 | 1.44%(-1.01)#4,884 |
| 64. | Manson | 0.41% | 0.54%(-0.135)#64 | 1.44%(-1.03)#4,960 |
| 65. | Altoona | 0.36% | 0.54%(-0.178)#65 | 1.44%(-1.07)#5,178 |
| 66. | Bancroft | 0.32% | 0.54%(-0.220)#66 | 1.44%(-1.11)#5,371 |
| 67. | Chariton | 0.29% | 0.54%(-0.257)#67 | 1.44%(-1.15)#5,546 |
| 68. | Center Point | 0.27% | 0.54%(-0.270)#68 | 1.44%(-1.17)#5,619 |
| 69. | Gilbert | 0.25% | 0.54%(-0.289)#69 | 1.44%(-1.18)#5,714 |
| 70. | Keota | 0.23% | 0.54%(-0.316)#70 | 1.44%(-1.21)#5,871 |
| 71. | Clive | 0.23% | 0.54%(-0.316)#71 | 1.44%(-1.21)#5,874 |
| 72. | Atlantic | 0.22% | 0.54%(-0.321)#72 | 1.44%(-1.22)#5,899 |
| 73. | Marquette | 0.21% | 0.54%(-0.328)#73 | 1.44%(-1.22)#5,948 |
| 74. | Waterloo | 0.21% | 0.54%(-0.328)#74 | 1.44%(-1.22)#5,949 |
| 75. | Ely | 0.20% | 0.54%(-0.347)#75 | 1.44%(-1.24)#6,064 |
| 76. | Creston | 0.19% | 0.54%(-0.356)#76 | 1.44%(-1.25)#6,116 |
| 77. | Sheldon | 0.17% | 0.54%(-0.376)#77 | 1.44%(-1.27)#6,236 |
| 78. | Council Bluffs | 0.17% | 0.54%(-0.377)#78 | 1.44%(-1.27)#6,238 |
| 79. | Indianola | 0.16% | 0.54%(-0.385)#79 | 1.44%(-1.28)#6,296 |
| 80. | Davenport | 0.15% | 0.54%(-0.388)#80 | 1.44%(-1.28)#6,318 |
| 81. | Walford | 0.14% | 0.54%(-0.403)#81 | 1.44%(-1.30)#6,415 |
| 82. | Dubuque | 0.13% | 0.54%(-0.411)#82 | 1.44%(-1.31)#6,456 |
| 83. | Peosta | 0.11% | 0.54%(-0.435)#83 | 1.44%(-1.33)#6,602 |
| 84. | Ottumwa | 0.10% | 0.54%(-0.440)#84 | 1.44%(-1.33)#6,637 |
| 85. | Anamosa | 0.091% | 0.54%(-0.451)#85 | 1.44%(-1.35)#6,701 |
| 86. | Sioux City | 0.088% | 0.54%(-0.455)#86 | 1.44%(-1.35)#6,720 |
Common Questions
What are the Top 10 Cities with the Highest Percentage of Thai Population in Iowa?
Top 10 Cities with the Highest Percentage of Thai Population in Iowa are:
#1
4.66%
#2
3.78%
#3
3.64%
#4
3.41%
#5
3.36%
#6
3.31%
#7
3.12%
#8
2.91%
#9
2.87%
#10
2.85%
What city has the Highest Percentage of Thai Population in Iowa?
Thor has the Highest Percentage of Thai Population in Iowa with 4.66%.
What is the Percentage of Thai Population in the State of Iowa?
Percentage of Thai Population in Iowa is 0.54%.
What is the Percentage of Thai Population in the United States?
Percentage of Thai Population in the United States is 1.44%.