Cities with the Highest Percentage of Thai Population in Missouri
RELATED REPORTS & OPTIONS
Thai
Missouri
Compare Cities
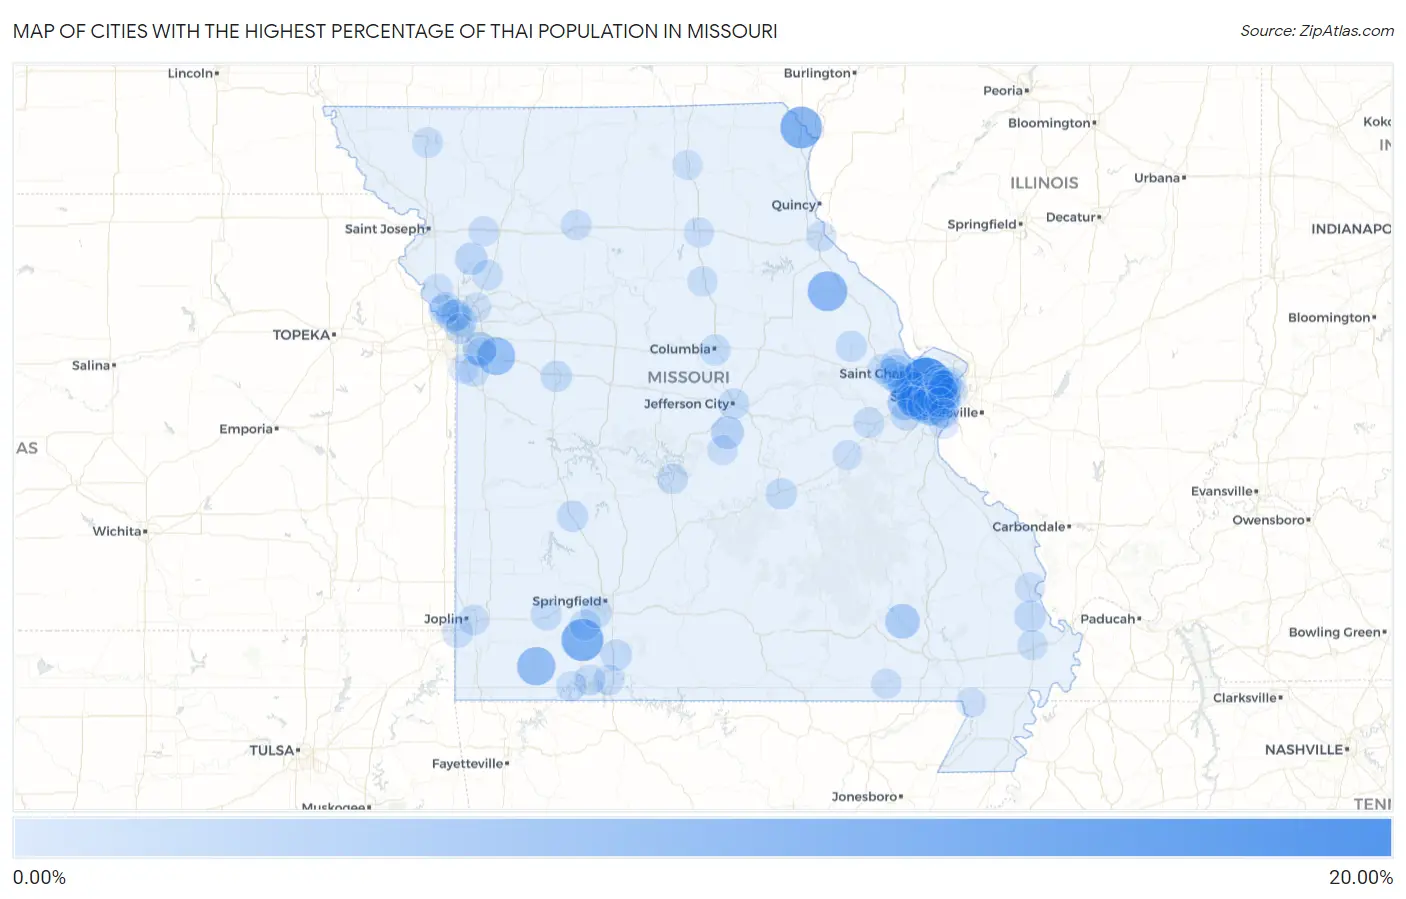
Map of Cities with the Highest Percentage of Thai Population in Missouri
0.00%
20.00%
Cities with the Highest Percentage of Thai Population in Missouri
| City | Thai | vs State | vs National | |
| 1. | Maryland Heights | 15.03% | 0.63%(+14.4)#1 | 1.44%(+13.6)#113 |
| 2. | Hurley | 9.17% | 0.63%(+8.55)#2 | 1.44%(+7.74)#254 |
| 3. | St Francisville | 9.00% | 0.63%(+8.37)#3 | 1.44%(+7.56)#264 |
| 4. | Chesterfield | 8.39% | 0.63%(+7.77)#4 | 1.44%(+6.96)#296 |
| 5. | Curryville | 7.45% | 0.63%(+6.82)#5 | 1.44%(+6.01)#357 |
| 6. | Butterfield | 6.46% | 0.63%(+5.83)#6 | 1.44%(+5.02)#440 |
| 7. | Manchester | 6.17% | 0.63%(+5.54)#7 | 1.44%(+4.73)#468 |
| 8. | Lake Lotawana | 6.07% | 0.63%(+5.44)#8 | 1.44%(+4.63)#480 |
| 9. | Ballwin | 5.14% | 0.63%(+4.52)#9 | 1.44%(+3.71)#590 |
| 10. | Weldon Spring | 4.64% | 0.63%(+4.02)#10 | 1.44%(+3.21)#673 |
| 11. | Town And Country | 4.46% | 0.63%(+3.83)#11 | 1.44%(+3.02)#714 |
| 12. | Olivette | 4.09% | 0.63%(+3.47)#12 | 1.44%(+2.65)#812 |
| 13. | Creve Coeur | 3.88% | 0.63%(+3.25)#13 | 1.44%(+2.44)#889 |
| 14. | Shrewsbury | 3.87% | 0.63%(+3.25)#14 | 1.44%(+2.44)#891 |
| 15. | Wildwood | 3.84% | 0.63%(+3.21)#15 | 1.44%(+2.40)#905 |
| 16. | Crystal Lake Park | 3.70% | 0.63%(+3.07)#16 | 1.44%(+2.26)#939 |
| 17. | Mill Spring | 3.67% | 0.63%(+3.04)#17 | 1.44%(+2.23)#951 |
| 18. | Ladue | 3.47% | 0.63%(+2.84)#18 | 1.44%(+2.03)#1,007 |
| 19. | Country Life Acres | 3.23% | 0.63%(+2.60)#19 | 1.44%(+1.79)#1,104 |
| 20. | Unity Village | 3.08% | 0.63%(+2.45)#20 | 1.44%(+1.64)#1,177 |
| 21. | Clayton | 2.88% | 0.63%(+2.25)#21 | 1.44%(+1.44)#1,266 |
| 22. | St Thomas | 2.41% | 0.63%(+1.78)#22 | 1.44%(+0.972)#1,520 |
| 23. | Huntleigh | 2.33% | 0.63%(+1.70)#23 | 1.44%(+0.888)#1,578 |
| 24. | Westwood | 2.27% | 0.63%(+1.64)#24 | 1.44%(+0.828)#1,621 |
| 25. | O Fallon | 2.04% | 0.63%(+1.42)#25 | 1.44%(+0.604)#1,764 |
| 26. | Plattsburg | 1.97% | 0.63%(+1.34)#26 | 1.44%(+0.533)#1,828 |
| 27. | Brentwood | 1.84% | 0.63%(+1.21)#27 | 1.44%(+0.398)#1,941 |
| 28. | Riverside | 1.79% | 0.63%(+1.17)#28 | 1.44%(+0.355)#2,002 |
| 29. | Valley Park | 1.72% | 0.63%(+1.10)#29 | 1.44%(+0.286)#2,072 |
| 30. | Green Park | 1.60% | 0.63%(+0.973)#30 | 1.44%(+0.162)#2,197 |
| 31. | Benton | 1.53% | 0.63%(+0.906)#31 | 1.44%(+0.095)#2,288 |
| 32. | Sunset Hills | 1.37% | 0.63%(+0.744)#32 | 1.44%(-0.067)#2,515 |
| 33. | Northmoor | 1.32% | 0.63%(+0.692)#33 | 1.44%(-0.118)#2,580 |
| 34. | Jennings | 1.30% | 0.63%(+0.674)#34 | 1.44%(-0.137)#2,616 |
| 35. | North Kansas City | 1.27% | 0.63%(+0.647)#35 | 1.44%(-0.164)#2,656 |
| 36. | Humansville | 1.27% | 0.63%(+0.647)#36 | 1.44%(-0.164)#2,657 |
| 37. | Saddlebrooke | 1.27% | 0.63%(+0.647)#37 | 1.44%(-0.164)#2,658 |
| 38. | Clever | 1.26% | 0.63%(+0.638)#38 | 1.44%(-0.173)#2,675 |
| 39. | Warrensburg | 1.25% | 0.63%(+0.621)#39 | 1.44%(-0.190)#2,702 |
| 40. | Lake St Louis | 1.24% | 0.63%(+0.614)#40 | 1.44%(-0.197)#2,713 |
| 41. | Clarkson Valley | 1.23% | 0.63%(+0.600)#41 | 1.44%(-0.210)#2,733 |
| 42. | Fenton | 1.22% | 0.63%(+0.594)#42 | 1.44%(-0.217)#2,743 |
| 43. | Rolla | 1.21% | 0.63%(+0.587)#43 | 1.44%(-0.224)#2,750 |
| 44. | Richmond Heights | 1.20% | 0.63%(+0.571)#44 | 1.44%(-0.240)#2,777 |
| 45. | Glendale | 1.19% | 0.63%(+0.564)#45 | 1.44%(-0.247)#2,791 |
| 46. | Dardenne Prairie | 1.17% | 0.63%(+0.543)#46 | 1.44%(-0.267)#2,835 |
| 47. | Eureka | 1.17% | 0.63%(+0.539)#47 | 1.44%(-0.272)#2,840 |
| 48. | Battlefield | 1.16% | 0.63%(+0.531)#48 | 1.44%(-0.280)#2,852 |
| 49. | St Charles | 1.13% | 0.63%(+0.508)#49 | 1.44%(-0.303)#2,890 |
| 50. | Vinita Park | 1.13% | 0.63%(+0.504)#50 | 1.44%(-0.307)#2,894 |
| 51. | Hawk Point | 1.12% | 0.63%(+0.490)#51 | 1.44%(-0.320)#2,925 |
| 52. | Weatherby Lake | 1.11% | 0.63%(+0.488)#52 | 1.44%(-0.323)#2,930 |
| 53. | Frontenac | 1.10% | 0.63%(+0.472)#53 | 1.44%(-0.338)#2,963 |
| 54. | Greendale | 1.08% | 0.63%(+0.454)#54 | 1.44%(-0.357)#2,999 |
| 55. | Normandy | 1.05% | 0.63%(+0.419)#55 | 1.44%(-0.391)#3,065 |
| 56. | Columbia | 1.05% | 0.63%(+0.419)#56 | 1.44%(-0.392)#3,067 |
| 57. | Mount Vernon | 1.00% | 0.63%(+0.371)#57 | 1.44%(-0.440)#3,171 |
| 58. | Jefferson City | 0.99% | 0.63%(+0.363)#58 | 1.44%(-0.448)#3,190 |
| 59. | St John | 0.97% | 0.63%(+0.345)#59 | 1.44%(-0.465)#3,234 |
| 60. | Raymore | 0.96% | 0.63%(+0.329)#60 | 1.44%(-0.482)#3,265 |
| 61. | Maplewood | 0.95% | 0.63%(+0.324)#61 | 1.44%(-0.487)#3,280 |
| 62. | Ellisville | 0.93% | 0.63%(+0.301)#62 | 1.44%(-0.509)#3,323 |
| 63. | Parkville | 0.93% | 0.63%(+0.299)#63 | 1.44%(-0.512)#3,331 |
| 64. | Loma Linda | 0.91% | 0.63%(+0.286)#64 | 1.44%(-0.525)#3,361 |
| 65. | Branson | 0.90% | 0.63%(+0.274)#65 | 1.44%(-0.536)#3,386 |
| 66. | Holt | 0.86% | 0.63%(+0.233)#66 | 1.44%(-0.578)#3,467 |
| 67. | Union | 0.83% | 0.63%(+0.208)#67 | 1.44%(-0.603)#3,523 |
| 68. | St Louis | 0.82% | 0.63%(+0.192)#68 | 1.44%(-0.619)#3,567 |
| 69. | Linn Creek | 0.81% | 0.63%(+0.183)#69 | 1.44%(-0.628)#3,580 |
| 70. | Kimberling City | 0.80% | 0.63%(+0.173)#70 | 1.44%(-0.637)#3,609 |
| 71. | Chillicothe | 0.79% | 0.63%(+0.165)#71 | 1.44%(-0.645)#3,633 |
| 72. | Des Peres | 0.79% | 0.63%(+0.161)#72 | 1.44%(-0.650)#3,647 |
| 73. | Maryville | 0.78% | 0.63%(+0.150)#73 | 1.44%(-0.661)#3,687 |
| 74. | St Paul | 0.76% | 0.63%(+0.135)#74 | 1.44%(-0.675)#3,725 |
| 75. | Kansas City | 0.74% | 0.63%(+0.114)#75 | 1.44%(-0.697)#3,778 |
| 76. | Duquesne | 0.74% | 0.63%(+0.113)#76 | 1.44%(-0.697)#3,780 |
| 77. | Bel Nor | 0.67% | 0.63%(+0.040)#77 | 1.44%(-0.770)#4,004 |
| 78. | Twin Oaks | 0.65% | 0.63%(+0.019)#78 | 1.44%(-0.791)#4,077 |
| 79. | Cape Girardeau | 0.64% | 0.63%(+0.011)#79 | 1.44%(-0.799)#4,105 |
| 80. | Shell Knob | 0.64% | 0.63%(+0.009)#80 | 1.44%(-0.801)#4,115 |
| 81. | Lee S Summit | 0.61% | 0.63%(-0.014)#81 | 1.44%(-0.825)#4,197 |
| 82. | Osborn | 0.60% | 0.63%(-0.028)#82 | 1.44%(-0.839)#4,241 |
| 83. | University City | 0.59% | 0.63%(-0.033)#83 | 1.44%(-0.843)#4,265 |
| 84. | Miner | 0.59% | 0.63%(-0.034)#84 | 1.44%(-0.845)#4,272 |
| 85. | Edmundson | 0.57% | 0.63%(-0.055)#85 | 1.44%(-0.866)#4,342 |
| 86. | Doniphan | 0.51% | 0.63%(-0.112)#86 | 1.44%(-0.923)#4,537 |
| 87. | Moberly | 0.49% | 0.63%(-0.138)#87 | 1.44%(-0.949)#4,628 |
| 88. | Macon | 0.48% | 0.63%(-0.150)#88 | 1.44%(-0.961)#4,681 |
| 89. | Webster Groves | 0.47% | 0.63%(-0.153)#89 | 1.44%(-0.963)#4,693 |
| 90. | Hannibal | 0.47% | 0.63%(-0.156)#90 | 1.44%(-0.967)#4,705 |
| 91. | Oakville | 0.44% | 0.63%(-0.189)#91 | 1.44%(-1.000)#4,814 |
| 92. | Liberty | 0.43% | 0.63%(-0.198)#92 | 1.44%(-1.01)#4,865 |
| 93. | Campbell | 0.43% | 0.63%(-0.200)#93 | 1.44%(-1.01)#4,873 |
| 94. | Mehlville | 0.42% | 0.63%(-0.207)#94 | 1.44%(-1.02)#4,904 |
| 95. | Platte City | 0.42% | 0.63%(-0.209)#95 | 1.44%(-1.02)#4,907 |
| 96. | Kirksville | 0.42% | 0.63%(-0.210)#96 | 1.44%(-1.02)#4,919 |
| 97. | Sullivan | 0.40% | 0.63%(-0.223)#97 | 1.44%(-1.03)#4,975 |
| 98. | Belton | 0.38% | 0.63%(-0.243)#98 | 1.44%(-1.05)#5,088 |
| 99. | St Elizabeth | 0.38% | 0.63%(-0.247)#99 | 1.44%(-1.06)#5,109 |
| 100. | Wentzville | 0.32% | 0.63%(-0.308)#100 | 1.44%(-1.12)#5,397 |
Common Questions
What are the Top 10 Cities with the Highest Percentage of Thai Population in Missouri?
Top 10 Cities with the Highest Percentage of Thai Population in Missouri are:
#1
15.03%
#2
9.17%
#3
9.00%
#4
8.39%
#5
7.45%
#6
6.46%
#7
6.17%
#8
6.07%
#9
5.14%
#10
4.64%
What city has the Highest Percentage of Thai Population in Missouri?
Maryland Heights has the Highest Percentage of Thai Population in Missouri with 15.03%.
What is the Percentage of Thai Population in the State of Missouri?
Percentage of Thai Population in Missouri is 0.63%.
What is the Percentage of Thai Population in the United States?
Percentage of Thai Population in the United States is 1.44%.