Cities with the Highest Percentage of Thai Population in New York
RELATED REPORTS & OPTIONS
Thai
New York
Compare Cities
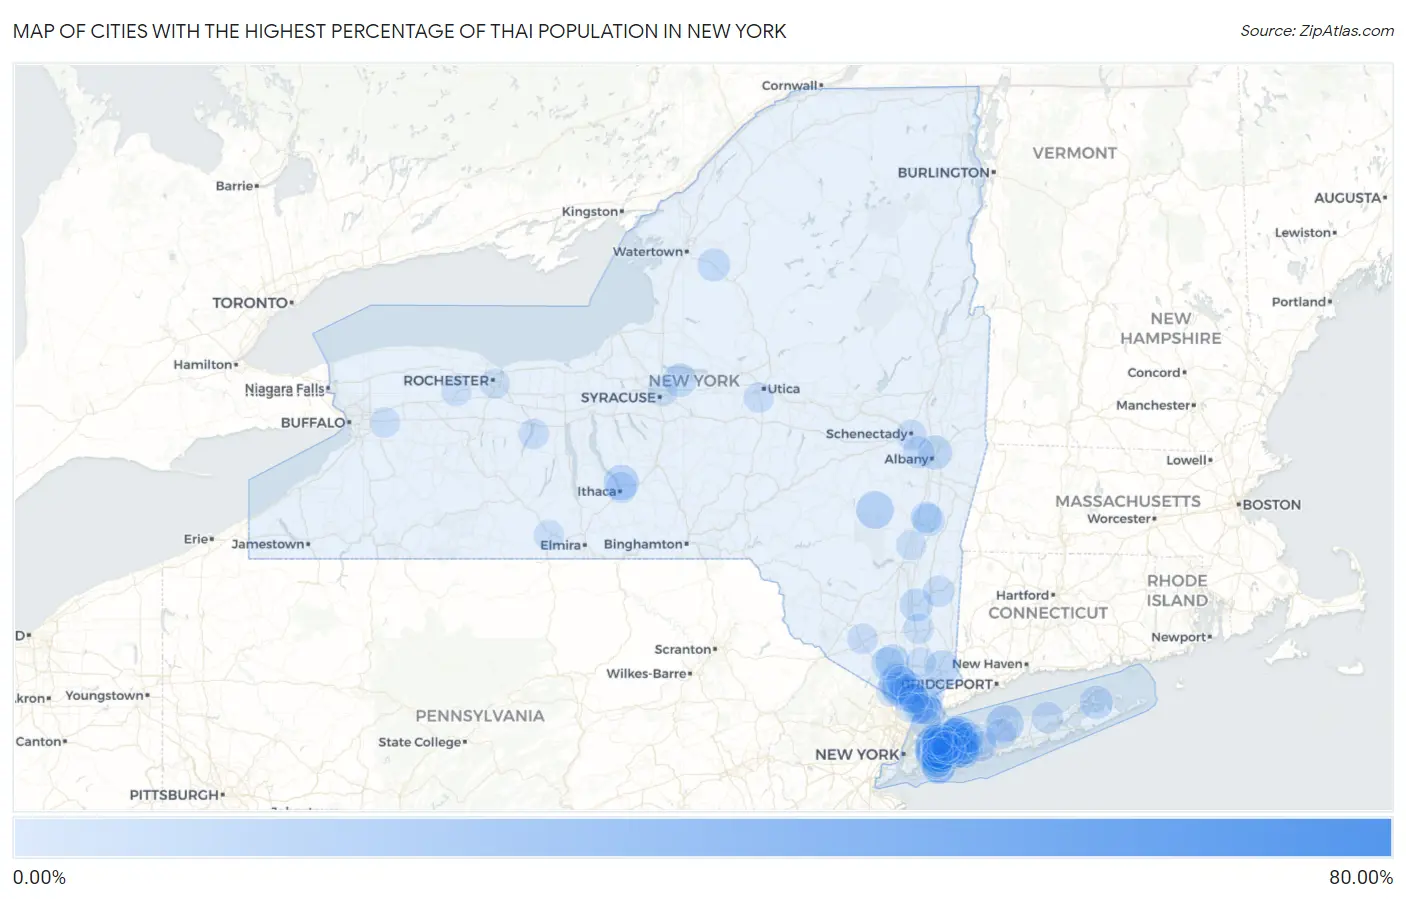
Map of Cities with the Highest Percentage of Thai Population in New York
0.00%
80.00%
Cities with the Highest Percentage of Thai Population in New York
| City | Thai | vs State | vs National | |
| 1. | Mongaup Valley | 67.45% | 2.12%(+65.3)#1 | 1.44%(+66.0)#2 |
| 2. | Manhasset Hills | 29.92% | 2.12%(+27.8)#2 | 1.44%(+28.5)#31 |
| 3. | North New Hyde Park | 22.80% | 2.12%(+20.7)#3 | 1.44%(+21.4)#51 |
| 4. | Herricks | 21.66% | 2.12%(+19.5)#4 | 1.44%(+20.2)#56 |
| 5. | Searingtown | 20.85% | 2.12%(+18.7)#5 | 1.44%(+19.4)#62 |
| 6. | Hicksville | 20.06% | 2.12%(+17.9)#6 | 1.44%(+18.6)#68 |
| 7. | Garden City Park | 18.83% | 2.12%(+16.7)#7 | 1.44%(+17.4)#74 |
| 8. | Bellerose Terrace | 16.25% | 2.12%(+14.1)#8 | 1.44%(+14.8)#103 |
| 9. | Muttontown | 14.60% | 2.12%(+12.5)#9 | 1.44%(+13.2)#121 |
| 10. | New Hyde Park | 14.56% | 2.12%(+12.4)#10 | 1.44%(+13.1)#123 |
| 11. | Pomona | 13.60% | 2.12%(+11.5)#11 | 1.44%(+12.2)#137 |
| 12. | Windham | 13.53% | 2.12%(+11.4)#12 | 1.44%(+12.1)#138 |
| 13. | Stony Brook University | 13.38% | 2.12%(+11.3)#13 | 1.44%(+11.9)#139 |
| 14. | Greenville Cdp Westchester County | 13.11% | 2.12%(+11.0)#14 | 1.44%(+11.7)#146 |
| 15. | Albertson | 11.29% | 2.12%(+9.16)#15 | 1.44%(+9.85)#185 |
| 16. | Lansing | 10.70% | 2.12%(+8.58)#16 | 1.44%(+9.26)#206 |
| 17. | Brookville | 10.64% | 2.12%(+8.52)#17 | 1.44%(+9.21)#207 |
| 18. | South Floral Park | 10.37% | 2.12%(+8.25)#18 | 1.44%(+8.94)#214 |
| 19. | Rochester Institute Of Technology | 10.37% | 2.12%(+8.25)#19 | 1.44%(+8.93)#215 |
| 20. | Bardonia | 10.22% | 2.12%(+8.10)#20 | 1.44%(+8.78)#220 |
| 21. | New City | 9.53% | 2.12%(+7.41)#21 | 1.44%(+8.09)#239 |
| 22. | Menands | 9.26% | 2.12%(+7.14)#22 | 1.44%(+7.83)#251 |
| 23. | Golden S Bridge | 9.25% | 2.12%(+7.13)#23 | 1.44%(+7.82)#252 |
| 24. | Jericho | 9.05% | 2.12%(+6.93)#24 | 1.44%(+7.62)#261 |
| 25. | New Hempstead | 9.01% | 2.12%(+6.89)#25 | 1.44%(+7.57)#262 |
| 26. | Elmont | 9.01% | 2.12%(+6.88)#26 | 1.44%(+7.57)#263 |
| 27. | Syosset | 8.65% | 2.12%(+6.52)#27 | 1.44%(+7.21)#280 |
| 28. | Woodbury | 8.64% | 2.12%(+6.51)#28 | 1.44%(+7.20)#282 |
| 29. | Salisbury Center | 8.63% | 2.12%(+6.51)#29 | 1.44%(+7.19)#284 |
| 30. | Oyster Bay Cove | 8.60% | 2.12%(+6.48)#30 | 1.44%(+7.16)#285 |
| 31. | Hewlett Bay Park | 8.22% | 2.12%(+6.09)#31 | 1.44%(+6.78)#309 |
| 32. | Shelter Island | 8.19% | 2.12%(+6.07)#32 | 1.44%(+6.75)#311 |
| 33. | Hewlett Neck | 8.11% | 2.12%(+5.99)#33 | 1.44%(+6.67)#315 |
| 34. | East Meadow | 8.11% | 2.12%(+5.98)#34 | 1.44%(+6.67)#316 |
| 35. | Bridgeport | 7.99% | 2.12%(+5.87)#35 | 1.44%(+6.56)#320 |
| 36. | Roslyn Heights | 7.98% | 2.12%(+5.86)#36 | 1.44%(+6.55)#321 |
| 37. | North Hills | 7.83% | 2.12%(+5.71)#37 | 1.44%(+6.40)#331 |
| 38. | Harriman | 7.72% | 2.12%(+5.59)#38 | 1.44%(+6.28)#338 |
| 39. | Elmsford | 7.61% | 2.12%(+5.49)#39 | 1.44%(+6.17)#347 |
| 40. | Old Bethpage | 7.58% | 2.12%(+5.46)#40 | 1.44%(+6.14)#349 |
| 41. | Arlington | 7.57% | 2.12%(+5.45)#41 | 1.44%(+6.13)#350 |
| 42. | North Valley Stream | 7.20% | 2.12%(+5.08)#42 | 1.44%(+5.76)#374 |
| 43. | Copenhagen | 7.19% | 2.12%(+5.07)#43 | 1.44%(+5.75)#375 |
| 44. | South Valley Stream | 7.08% | 2.12%(+4.95)#44 | 1.44%(+5.64)#383 |
| 45. | Jefferson | 6.99% | 2.12%(+4.87)#45 | 1.44%(+5.56)#391 |
| 46. | Franklin Square | 6.85% | 2.12%(+4.73)#46 | 1.44%(+5.41)#406 |
| 47. | Bethpage | 6.60% | 2.12%(+4.47)#47 | 1.44%(+5.16)#426 |
| 48. | Hudson | 6.57% | 2.12%(+4.45)#48 | 1.44%(+5.13)#429 |
| 49. | Old Westbury | 6.51% | 2.12%(+4.39)#49 | 1.44%(+5.07)#434 |
| 50. | Plainview | 6.36% | 2.12%(+4.24)#50 | 1.44%(+4.93)#445 |
| 51. | Upper Brookville | 6.22% | 2.12%(+4.10)#51 | 1.44%(+4.79)#459 |
| 52. | Thornwood | 6.19% | 2.12%(+4.07)#52 | 1.44%(+4.75)#462 |
| 53. | Westmere | 6.09% | 2.12%(+3.97)#53 | 1.44%(+4.65)#475 |
| 54. | Valley Stream | 6.09% | 2.12%(+3.97)#54 | 1.44%(+4.65)#476 |
| 55. | Dix Hills | 6.07% | 2.12%(+3.95)#55 | 1.44%(+4.64)#478 |
| 56. | Salisbury | 6.03% | 2.12%(+3.91)#56 | 1.44%(+4.60)#483 |
| 57. | Millwood | 5.60% | 2.12%(+3.48)#57 | 1.44%(+4.17)#532 |
| 58. | Plainedge | 5.60% | 2.12%(+3.48)#58 | 1.44%(+4.16)#533 |
| 59. | Scarsdale | 5.58% | 2.12%(+3.46)#59 | 1.44%(+4.14)#535 |
| 60. | Baiting Hollow | 5.52% | 2.12%(+3.40)#60 | 1.44%(+4.08)#546 |
| 61. | Athens | 5.38% | 2.12%(+3.26)#61 | 1.44%(+3.94)#560 |
| 62. | Lake Success | 5.38% | 2.12%(+3.26)#62 | 1.44%(+3.94)#561 |
| 63. | Millbrook | 5.35% | 2.12%(+3.23)#63 | 1.44%(+3.92)#563 |
| 64. | Hartsdale | 5.32% | 2.12%(+3.20)#64 | 1.44%(+3.88)#566 |
| 65. | Williston Park | 5.22% | 2.12%(+3.10)#65 | 1.44%(+3.79)#577 |
| 66. | Congers | 5.16% | 2.12%(+3.04)#66 | 1.44%(+3.73)#587 |
| 67. | Ardsley | 5.09% | 2.12%(+2.96)#67 | 1.44%(+3.65)#603 |
| 68. | Cayuga Heights | 5.04% | 2.12%(+2.92)#68 | 1.44%(+3.61)#610 |
| 69. | Garden City South | 5.01% | 2.12%(+2.89)#69 | 1.44%(+3.57)#612 |
| 70. | Schenectady | 4.64% | 2.12%(+2.51)#70 | 1.44%(+3.20)#675 |
| 71. | Clifton Knolls-Mill Creek | 4.59% | 2.12%(+2.47)#71 | 1.44%(+3.16)#682 |
| 72. | Carle Place | 4.50% | 2.12%(+2.38)#72 | 1.44%(+3.06)#706 |
| 73. | Roessleville | 4.39% | 2.12%(+2.26)#73 | 1.44%(+2.95)#725 |
| 74. | Scotchtown | 4.39% | 2.12%(+2.26)#74 | 1.44%(+2.95)#726 |
| 75. | Roslyn Estates | 4.37% | 2.12%(+2.25)#75 | 1.44%(+2.93)#729 |
| 76. | Thomaston | 4.33% | 2.12%(+2.20)#76 | 1.44%(+2.89)#744 |
| 77. | Montebello | 4.33% | 2.12%(+2.20)#77 | 1.44%(+2.89)#745 |
| 78. | Crystal Beach | 4.29% | 2.12%(+2.17)#78 | 1.44%(+2.85)#756 |
| 79. | Deer Park | 4.27% | 2.12%(+2.15)#79 | 1.44%(+2.83)#761 |
| 80. | Plandome Heights | 4.26% | 2.12%(+2.14)#80 | 1.44%(+2.83)#766 |
| 81. | Washington Mills | 4.24% | 2.12%(+2.12)#81 | 1.44%(+2.80)#773 |
| 82. | Nyack | 4.24% | 2.12%(+2.11)#82 | 1.44%(+2.80)#774 |
| 83. | Gang Mills | 4.19% | 2.12%(+2.06)#83 | 1.44%(+2.75)#784 |
| 84. | Merritt Park | 4.15% | 2.12%(+2.03)#84 | 1.44%(+2.71)#792 |
| 85. | Pelham | 4.13% | 2.12%(+2.01)#85 | 1.44%(+2.69)#803 |
| 86. | Floral Park | 4.05% | 2.12%(+1.93)#86 | 1.44%(+2.61)#823 |
| 87. | Malden On Hudson | 4.05% | 2.12%(+1.93)#87 | 1.44%(+2.61)#824 |
| 88. | Oyster Bay | 4.02% | 2.12%(+1.90)#88 | 1.44%(+2.58)#838 |
| 89. | Lyncourt | 3.96% | 2.12%(+1.83)#89 | 1.44%(+2.52)#857 |
| 90. | Bergen | 3.91% | 2.12%(+1.79)#90 | 1.44%(+2.47)#872 |
| 91. | West Hills | 3.91% | 2.12%(+1.79)#91 | 1.44%(+2.47)#873 |
| 92. | South Nyack | 3.90% | 2.12%(+1.78)#92 | 1.44%(+2.46)#877 |
| 93. | Lake Mohegan | 3.89% | 2.12%(+1.77)#93 | 1.44%(+2.45)#882 |
| 94. | Dobbs Ferry | 3.83% | 2.12%(+1.71)#94 | 1.44%(+2.39)#907 |
| 95. | Brighton | 3.82% | 2.12%(+1.70)#95 | 1.44%(+2.38)#910 |
| 96. | East Williston | 3.76% | 2.12%(+1.64)#96 | 1.44%(+2.33)#921 |
| 97. | Mount Ivy | 3.75% | 2.12%(+1.63)#97 | 1.44%(+2.31)#925 |
| 98. | Tappan | 3.72% | 2.12%(+1.60)#98 | 1.44%(+2.28)#932 |
| 99. | Town Line | 3.69% | 2.12%(+1.57)#99 | 1.44%(+2.25)#940 |
| 100. | Nesconset | 3.69% | 2.12%(+1.57)#100 | 1.44%(+2.25)#941 |
Common Questions
What are the Top 10 Cities with the Highest Percentage of Thai Population in New York?
Top 10 Cities with the Highest Percentage of Thai Population in New York are:
#1
29.92%
#2
22.80%
#3
21.66%
#4
20.85%
#5
20.06%
#6
18.83%
#7
16.25%
#8
14.60%
#9
14.56%
#10
13.60%
What city has the Highest Percentage of Thai Population in New York?
Manhasset Hills has the Highest Percentage of Thai Population in New York with 29.92%.
What is the Percentage of Thai Population in the State of New York?
Percentage of Thai Population in New York is 2.12%.
What is the Percentage of Thai Population in the United States?
Percentage of Thai Population in the United States is 1.44%.